collecting - Seneca Valley School District
advertisement
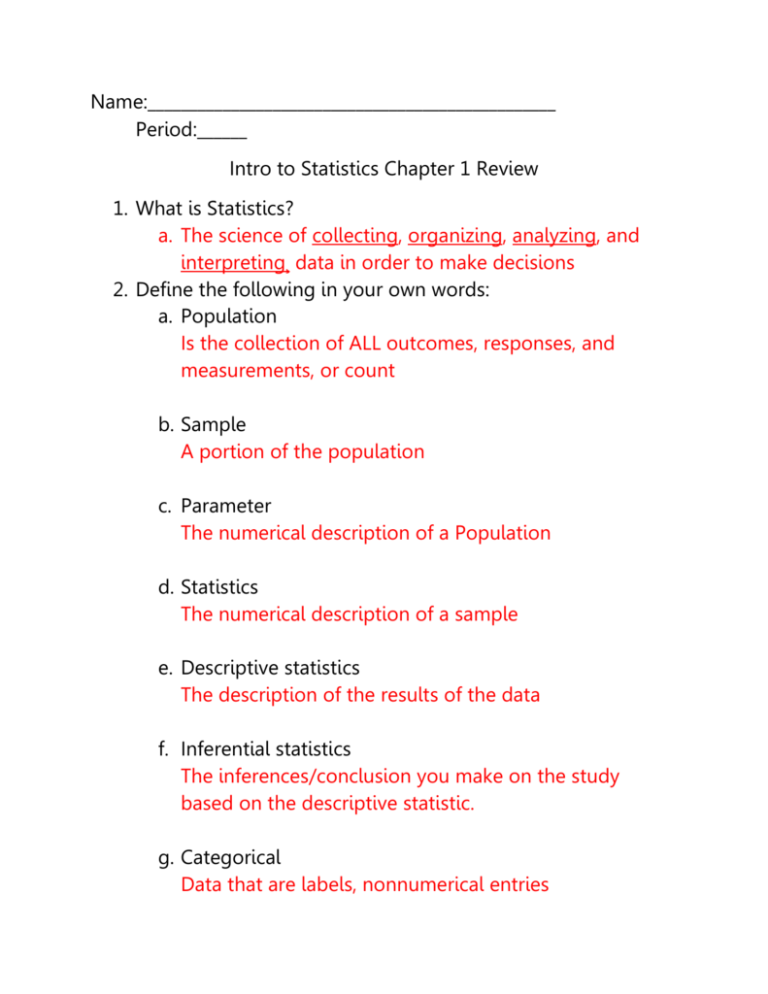
Name:_________________________________________________ Period:______ Intro to Statistics Chapter 1 Review 1. What is Statistics? a. The science of collecting, organizing, analyzing, and interpreting¸ data in order to make decisions 2. Define the following in your own words: a. Population Is the collection of ALL outcomes, responses, and measurements, or count b. Sample A portion of the population c. Parameter The numerical description of a Population d. Statistics The numerical description of a sample e. Descriptive statistics The description of the results of the data f. Inferential statistics The inferences/conclusion you make on the study based on the descriptive statistic. g. Categorical Data that are labels, nonnumerical entries h. Quantitative Data that consists of counts or numerical measurements i. Census A count or measurement of the ENTIRE population In problems 3-5 determine whether the data is a population or a sample. 3. The hair color of every third customer that walks into the shopping center. Sample 4. The age of every student in the Seneca Valley High School. Population 5. A survey of 24 of a company’s 200 employees. Sample In problems 6-7, identify the population and the sample. 6. A survey of 118 men in the United States found that more than 38% are beginning to show signs of baldness. Population: Men in the U.S Sample: 118 Men in the U.S 7. A survey of 752 city bus drivers found that 72% of people leave their trash on the floor of the bus. Population: City bus drivers Sample: 752 City bus drivers In problems 8-9, determine whether the value is a parameter or a statistic. 8. The 2006 team payroll of the New York Mets was $101,084,963. Parameter it is a population, it’s the New York Mets team 9. In a survey of 752 adults in the Unites States, 42% think there should be a law that prohibits people from talking on cell phones in public places. Statistic it is a sample of adults In problems 10-11 circle the descriptive statistic and make an inference based on what you read. 10. A study of 146 credit cards found that the average late fee is $27.46 That late fees are expensive. 11. A survey of 1205 physicians found that about 60% considered leaving the practice of medicine because they were discouraged over the state of the U.S health care. That health care is a big deciding factor on becoming and staying a doctor due to its changes. In problems 12-14 classify the data as Categorical or quantitative. 12. The number of students in a classroom. Quantitative – it is a number that can be counted 13. The Social Security numbers of employees at a corporation. Categorical – it labels someone for the gov’t 14. The ages of a sample of 350 employees of a software company. Quantitative – it is a number 15. What are the 4 levels of measurement? State examples or how you know which one to pick. 1.) Nominal – labels; red, Mr. Smith 2.) Ordinal – Can be put in order but there is no mathematical difference; Movie ratings 3.) Interval – Can be put in order and there is a mathematical difference; can go below zero; Dates 4.) Ratio – Can be put in order and there is mathematical difference but zero represents none can’t go below zero; Height In problems 16-19, classify the data set by its level of measurement. 16. 17. 18. 19. The stages of development of an infant Ordinal The number of cows in a field Ratio A list of college majors. Nominal The daily low temperatures for a week in July Interval 20. What are the 6 steps in designing a statistical study? 1.) Figure out population 2.) Figure out how your going to collect data 3.) Collect the data 4.) Describe the data by using descriptive statistic 5.) Interpret the data by using inferential statistic 6.) State possible errors. 21. What are the 4 types of methods of data collection? State examples or how you know which one to use at a specific time. 1.) Observational: only observe do not associate with people 2.) Experiment: have a control and treatment group 3.) Simulation: use when experiment would be expensive and dangerous. 4.) Survey: ask people questions In problems 22-25, decide which method of data collection you would use to gather data for each study. 22. A study on the effect of calcium intake on women with Osteoporosis. Experiment 23. The political party affiliation of people living in Jackson Township. Survey 24. A study of the mannerisms of high school students when taking an exam. Observation 25. A study of how second-hand smoke affects pregnancy. Simulation 26. What are the 3 Key elements of a well designed experiment? Give a brief explanation of each. 1.) Control influential factors: be sure 2 things aren’t happening at once. Watch for the placebo effect 2.) Randomization: randomly assign people to groups 3.) Replacement: make sure a lot of people are involved 27. What is the placebo effect? People will be given a water pill and believe that it is actual medication and cure their problems. 28. What are the 5 sampling techniques? Give example or brief explanation on when to use each one. 1.) Simple Random Sample: people are chosen at random using a random number generator 2.) Stratified: put people in group based on characteristics take a few people from each group 3.) Cluster: people are automatically put into groups/clusters pick 1 or 2 clusters. 4.) Systematic: every 5th person 5.) Convenience: At the convenience of the researcher (Ms. Halliday using her own students in a study. This is never a good idea, as it presents much bias!) In problems 29-32, identify the sampling technique used in each collection. Study: Students from the Senior High were asked whether or not they plan to go to college. 29. Students are ordered by ID numbers, and then every 20th student is questioned. Systematic 30. Students are separated by family income level, then 50 students from each group of selected. Stratified 31. Students are labeled by a number, and selected using a random number generator. Random Sample 32. Five streets are randomly selected in a plan, and then every household located on each of those five streets are questioned. Cluster
