Outcome 1 - Reconnecting America
advertisement
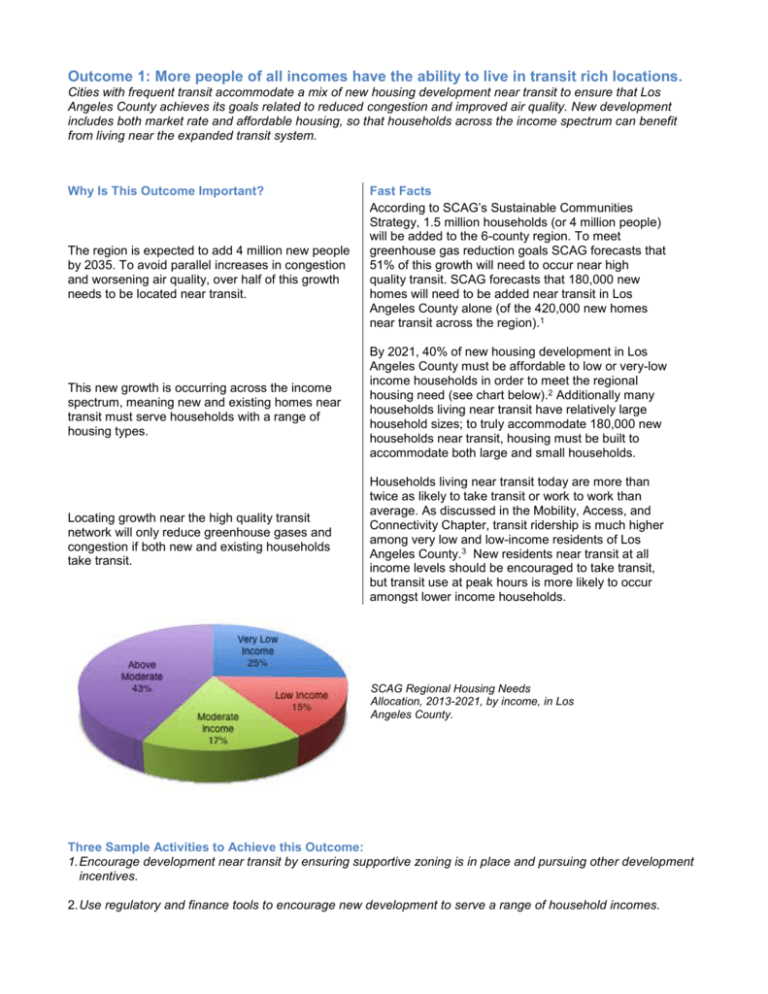
Outcome 1: More people of all incomes have the ability to live in transit rich locations. Cities with frequent transit accommodate a mix of new housing development near transit to ensure that Los Angeles County achieves its goals related to reduced congestion and improved air quality. New development includes both market rate and affordable housing, so that households across the income spectrum can benefit from living near the expanded transit system. Why Is This Outcome Important? The region is expected to add 4 million new people by 2035. To avoid parallel increases in congestion and worsening air quality, over half of this growth needs to be located near transit. This new growth is occurring across the income spectrum, meaning new and existing homes near transit must serve households with a range of housing types. Locating growth near the high quality transit network will only reduce greenhouse gases and congestion if both new and existing households take transit. Fast Facts According to SCAG’s Sustainable Communities Strategy, 1.5 million households (or 4 million people) will be added to the 6-county region. To meet greenhouse gas reduction goals SCAG forecasts that 51% of this growth will need to occur near high quality transit. SCAG forecasts that 180,000 new homes will need to be added near transit in Los Angeles County alone (of the 420,000 new homes near transit across the region).1 By 2021, 40% of new housing development in Los Angeles County must be affordable to low or very-low income households in order to meet the regional housing need (see chart below).2 Additionally many households living near transit have relatively large household sizes; to truly accommodate 180,000 new households near transit, housing must be built to accommodate both large and small households. Households living near transit today are more than twice as likely to take transit or work to work than average. As discussed in the Mobility, Access, and Connectivity Chapter, transit ridership is much higher among very low and low-income residents of Los Angeles County.3 New residents near transit at all income levels should be encouraged to take transit, but transit use at peak hours is more likely to occur amongst lower income households. SCAG Regional Housing Needs Allocation, 2013-2021, by income, in Los Angeles County. Three Sample Activities to Achieve this Outcome: 1. Encourage development near transit by ensuring supportive zoning is in place and pursuing other development incentives. 2. Use regulatory and finance tools to encourage new development to serve a range of household incomes. 3. At the countywide scale, deploy tools to implement and achieve the Sustainable Communities Strategy goals. Understand the full increment of new development and increased density called for in the SCS and how that compares with recent development projects near transit to determine whether the County is on track to absorb the full increment of growth needed. Where Are We Today? Atlas Maps Map B1-1 Residential Density map shows transit rich neighborhoods that currently have higher residential densities. New transit in corridors like Van Nuys in the valley will serve high population densities while corridors like the Gold Line extension will be more of a commuter corridor. The Rapid Bus network also serves population rich areas as well. Map B1-2 Existing Zoning, 2009 shows that while many jurisdictions have adopted transit supportive plans, station areas throughout the region have a long way to go to allow for new development near transit. With 63 jurisdictions touching the frequent transit network, adopting supportive zoning codes to accommodate 180,000 new units will require significant additional work. Map B1-3 Average Household Sizes shows concentrations of higher household sizes near parts of the frequent transit network. Areas near the Blue Line in South Los Angeles, the northeast San Fernando Valley, and the southeastern San Gabriel Valley have higher household sizes. The fact that the frequent transit network today accommodates a range of household sizes reinforces that future growth will also need to support a variety of household types. Map B1-4 Median Income Under $35K and Household Size Shows where concentrations of households with incomes under $35K live and where household size is below the regional average. Generally, neighborhoods with higher incomes also have smaller household sizes. This map shows that areas in Los Angeles County with lower incomes also have higher household sizes, meaning they are likely trying to save money with more crowded living conditions. Other Potential Maps: A map showing locations where the allowable building envelope is significantly higher than current buildings on the property could help jurisdictions understand true development potential near transit, identify areas at risk of displacement through tear-down and rebuild activities, and establish value capture mechanisms to generate revenue for affordable housing. Sources and References 1 Southern California Association of Governments, Sustainable Communities Strategy 2 Southern California Association of Governments, Regional Housing Needs Allocation 3 Center for Transit-Oriented Development, TOD Database, Reconnecting America. For more please refer to Chapter A, Outcome 3. Other Resources


