IEEE Paper Template in A4 (V1)
advertisement

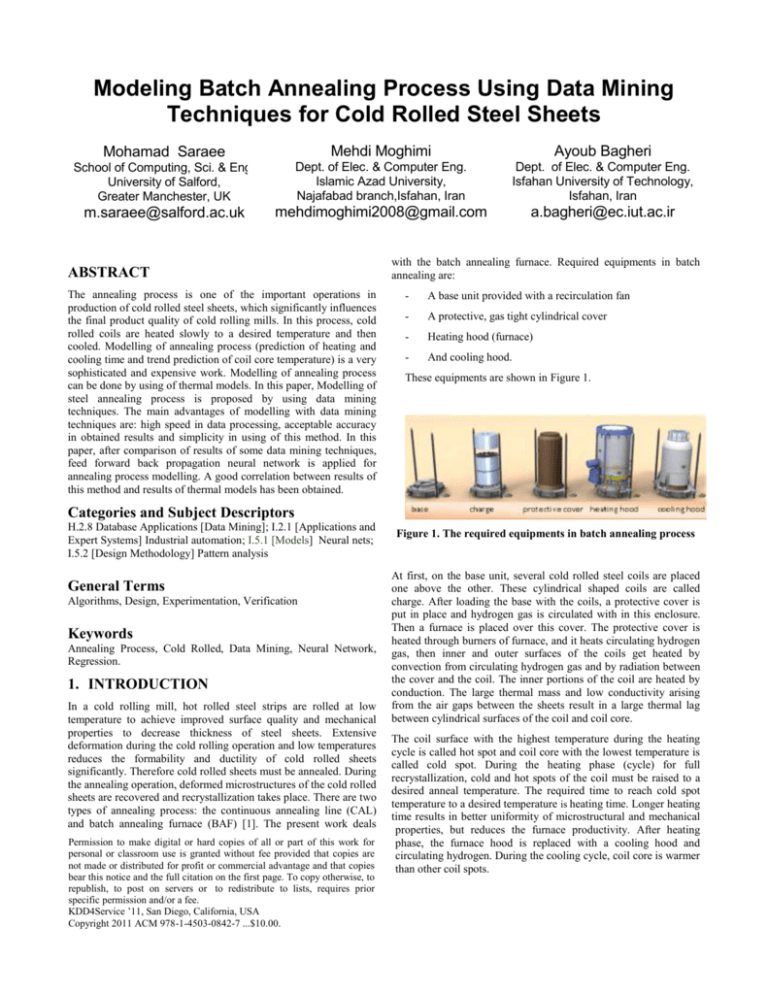
Modeling Batch Annealing Process Using Data Mining Techniques for Cold Rolled Steel Sheets Mohamad Saraee Mehdi Moghimi Ayoub Bagheri School of Computing, Sci. & Eng. University of Salford, Greater Manchester, UK Dept. of Elec. & Computer Eng. Islamic Azad University, Najafabad branch,Isfahan, Iran Dept. of Elec. & Computer Eng. Isfahan University of Technology, Isfahan, Iran m.saraee@salford.ac.uk mehdimoghimi2008@gmail.com a.bagheri@ec.iut.ac.ir ABSTRACT The annealing process is one of the important operations in production of cold rolled steel sheets, which significantly influences the final product quality of cold rolling mills. In this process, cold rolled coils are heated slowly to a desired temperature and then cooled. Modelling of annealing process (prediction of heating and cooling time and trend prediction of coil core temperature) is a very sophisticated and expensive work. Modelling of annealing process can be done by using of thermal models. In this paper, Modelling of steel annealing process is proposed by using data mining techniques. The main advantages of modelling with data mining techniques are: high speed in data processing, acceptable accuracy in obtained results and simplicity in using of this method. In this paper, after comparison of results of some data mining techniques, feed forward back propagation neural network is applied for annealing process modelling. A good correlation between results of this method and results of thermal models has been obtained. with the batch annealing furnace. Required equipments in batch annealing are: - A base unit provided with a recirculation fan - A protective, gas tight cylindrical cover - Heating hood (furnace) - And cooling hood. These equipments are shown in Figure 1. Categories and Subject Descriptors H.2.8 Database Applications [Data Mining]; I.2.1 [Applications and Expert Systems] Industrial automation; I.5.1 [Models] Neural nets; I.5.2 [Design Methodology] Pattern analysis General Terms Algorithms, Design, Experimentation, Verification Keywords Annealing Process, Cold Rolled, Data Mining, Neural Network, Regression. 1. INTRODUCTION In a cold rolling mill, hot rolled steel strips are rolled at low temperature to achieve improved surface quality and mechanical properties to decrease thickness of steel sheets. Extensive deformation during the cold rolling operation and low temperatures reduces the formability and ductility of cold rolled sheets significantly. Therefore cold rolled sheets must be annealed. During the annealing operation, deformed microstructures of the cold rolled sheets are recovered and recrystallization takes place. There are two types of annealing process: the continuous annealing line (CAL) and batch annealing furnace (BAF) [1]. The present work deals Permission to make digital or hard copies of all or part of this work for personal or classroom use is granted without fee provided that copies are not made or distributed for profit or commercial advantage and that copies bear this notice and the full citation on the first page. To copy otherwise, to republish, to post on servers or to redistribute to lists, requires prior specific permission and/or a fee. KDD4Service ’11, San Diego, California, USA Copyright 2011 ACM 978-1-4503-0842-7 ...$10.00. Figure 1. The required equipments in batch annealing process At first, on the base unit, several cold rolled steel coils are placed one above the other. These cylindrical shaped coils are called charge. After loading the base with the coils, a protective cover is put in place and hydrogen gas is circulated with in this enclosure. Then a furnace is placed over this cover. The protective cover is heated through burners of furnace, and it heats circulating hydrogen gas, then inner and outer surfaces of the coils get heated by convection from circulating hydrogen gas and by radiation between the cover and the coil. The inner portions of the coil are heated by conduction. The large thermal mass and low conductivity arising from the air gaps between the sheets result in a large thermal lag between cylindrical surfaces of the coil and coil core. The coil surface with the highest temperature during the heating cycle is called hot spot and coil core with the lowest temperature is called cold spot. During the heating phase (cycle) for full recrystallization, cold and hot spots of the coil must be raised to a desired anneal temperature. The required time to reach cold spot temperature to a desired temperature is heating time. Longer heating time results in better uniformity of microstructural and mechanical properties, but reduces the furnace productivity. After heating phase, the furnace hood is replaced with a cooling hood and circulating hydrogen. During the cooling cycle, coil core is warmer than other coil spots. The time to reach coil core temperature to predefined unloading temperature (160°c) is the cooling time. Variations in steel grades and coil dimensions necessitate a supervisory process model. Process models predict temperature evolution during batch annealing. It is important to note that process models are primarily thermal models. Efforts have been made in most plants to develop such a model. At first, Meyer and Woelk [2] developed the theoretical basis of a mathematical model of the annealing furnace. Harvey [3] also developed a mathematical simulation of the annealing process. Rovito et al. [4, 5] developed an online model, mostly based on statistical functions, to predict the end time of the annealing process and the cold spot temperature. Sahay and Kumar [6] developed an integrated model for batch annealing furnace with prediction capability extended to microstructural and final mechanical properties. Pal et al. [7] presented an efficient model for batch annealing using neural network. In this work, a neural network developed using simulations of the integrated model for batch annealing then the neural network model was used to determine the optimum coil dimensions. In this paper, Data Mining (DM) techniques are used to model annealing process. DM is the exploration and analysis process of large data quantities in order to discover meaningful patterns and rules. Application of DM techniques in manufacturing began in 1990 [8]. Data mining is now used in many different areas in manufacture engineering to extract knowledge for use in predictive maintenance, fault detection, design, production, quality assurance, scheduling, and decision support systems [9]. Modeling of annealing process using DM techniques has following advantages. 1) High speed in data processing. 2) There is no need too much expertise in the area of metallurgy or mechanical. X1,…,Xn, each record contains p attribute (variable), A1,…,Ap, describing a tuple, X, that is X=(x1,…,xp) and xi is value of attribute Ai. There is m class (label) in the database. Decision tree has a flowchart-like tree structure, where each internal node (non leaf node) denotes a test on an attribute, each branch represents an output of the test and label of each leaf node is one of these m classes. Decision tree can be adopted so as to predict continuous values rather than class labels. Since the terms “regression” and “numeric prediction” are used synonymously in statistics, the resulting trees were called “regression trees”, even though they do not use any regression equations. In the regression tree, each leaf stores a continuous-valued prediction, which is actually, the average value of the predicted attribute for training tuples that reach the leaf. Regression trees were proposed as component of the CART (classification and regression tree) [11]. 2.3 Neural Network The Neural Networks (NN) are powerful tools for prediction and classification tasks in data mining. NN is a useful tool for analysing and predicting the behaviour of systems that is hard to describe by any analytical or physical equations. NNs have the ability to learn from set of examples and generalize this knowledge to new situations. NN represents a structure similar to biological neurons of human brain and contains neurons in parallel grouped in different layers designed as an input layer, hidden layers and output layer as shown in Figure 2. The obtained results are acceptable in comparing with thermal models. 2. RELEVANT DATA MINING THECHNIQUES 2.1 Regression Regression is the most common statistical modeling techniques that can be used to model the relationship between one or more independent (predictor) variables and a dependent (response) variable. It allows response variable to be modeled as a linear function can be written as equation 1: Figure 1. Schematic diagram of the network structure showing input, hidden and output layers Each neuron has three main components: weight, bias, activation (transfer) function. For calculating the outputs from the inputs, the linear functions of the inputs xj are multiplied by the weights wij and operated by a sigmoid as an activation function so that each input contributes to every hidden unit, where N is the total number of input variables (equation 2, 3): Where x1,…, xn are n independent variables, y is response variable and αi i=1,…,n that called regression coefficients, are unknown constants to be determined from data. The least squares method is used to estimate these coefficients to minimize the sum of squares of the error between response variable and estimated values by the regression model [10]. 2.2 Regression Tree Decision tree is one of the most important techniques used in data mining. Suppose there is a database that contains n records, The bias is designated as b and is similar to the constant in linear regression, the transfer from the hidden units to the output is linear, and is given by: The output y in equation 4 is a non-linear function of xj. Thus, the network is completely described if network topology (the number of input nodes, output nodes and the hidden units) are known along with all the weights wij and biases bi. The multilayer feed forward back propagation neural network (BPNN) is one of the simplest and most applicable networks being used in performing higher level human task such as predicting, diagnosis, classification, decision making and planning [12]. The “feed forward” term refers to that outputs of a layer feed to next layer. The “back propagation” is a supervised learning algorithm to train neural network. In this method, the network is presented with patterns, (inputs and targeted outputs), in forward direction network output is calculated then based on BP algorithm, neurons weights of the layers update to minimize the sum of squared error between network output and targeted output. These modifications are made in backward direction, from the output layer to input layer. Detailed descriptions on neural network can be found in literature [13, 14]. Height of charge (m) 3.54 5.45 5.076 0.29 Weight of charge (kg) 33870 125860 86084 18681 Heating time (s) 57960 134280 89657 16017 Cooling time (s) 31680 88200 63140 10466 Also, there is a time- temperature trend of coil core, during the annealing process. Figure 3 shows an instance of these trends. Figure 2. An instance of trends of coil core temperature, during annealing process. 3. MODELING AND ANALYSIS OF ANNEALING PROCESS 3.1 Experiments 3.2 Heating and Cooling Times Prediction In this study, a database of annealed coils in Box annealing plant in Mobarakeh Steel Company (MSC) is provided to model annealing process. This database included 5554 records that each record contains values of following attributes that are important to model annealing process. In order to predict the heating and cooling times in annealing process, regression, regression tree and neural network models are developed. Inputs of these models are weight, width, outer diameter and thickness of coils, steel grades, annealing temperature set point, weight and height of charge. The heating and cooling times are as outputs of these models. Available data randomly divided to two sets, training and testing datasets. Models are trained using a set of training data. To validate the generalization capability of the newly trained models, a set of test data that not used in the training phase is applied. 1) Coil dimensions: weigh, width, thickness and outer diameter. 2) Heating and cooling times. 3) Annealing temperature set point (anneal sp), this determines based on the steel quality by metallurgy specialist. 4) Charge dimensions contain weight and height charge. 5) Steel grades: ST12, ST13, ST14 that are steel grades standards Statistical analysis of the variables used to develop for annealing process modeling is shown in Table 1. Table 1. Statistical analysis of the variables used to develop for annealing process modeling Attribute Min Max Mean Std Anneal sp (°c) 620 698 652.7 11.7565 Thickness (mm) 0.5 3 1 0.5 Weight (kg) 4430 35000 20153 5253.65 Outer diameter (m) 1.04 2.27 1.82 0.1785 Width (m) 0.61 1.64 1.145 0.1868 3.3 Trend Prediction of Coil Core Temperature During the annealing process, availability to coil core is difficult, in addition there is a thermal gap between coil core and coil surfaces. Therefore, to get sure about full recrystallization, it is necessary to know coil core temperature reaches to the desired annealing temperature. As the before mentioned, there are trends of coil core temperature from data gathered Box annealing plant in MSC. The schemas of these trends approximately are similar. At first, each trend divided to two phases: heating phase and cooling phase, then for each trend in two phases, a polynomial function with degree four is fitted based on least squared method using curve fitting toolbox of MATLAB 7.8 software. The polynomials such as p(t), fitted to heating curve and q(t), fitted to cooling curve that can be written as equation 5 and 6: where , ,i=1,...,5 are coefficients of polynomials are fitted to heating and cooling curves, respectively, and t is the heating time in equation 5 and the cooling time in equation 6. For predicting trend of coil core temperature, it is sufficient to predict polynomial coefficients. For prediction of each coefficient (pi,qi i=1,…,5), a neural network is developed. Inputs of each network contains width, outer diameter, thickness and weight of coils, weight and height of charge, annealing temperature set point and steel grades and output of each network is one of these coefficients. 4. RESULTS AND DISCUSSION In this study, average absolute relative error index (ARRE) is used to qualify the generalization capability of the training and testing regression, regression tree and NN models. ARRE can be written as, Where is actual value of targeted output and is predicted output value of the model, N is the number of applied data sets. Also the root of mean squared error index (RMSE) is used to measure the accuracy of predicted trends of coil core temperature during heating and cooling phases using NNs in the mentioned method. RMSE can be written as equation 8, Where is actual temperature at time point t, is predicted temperature at time point t and d is number of time units (values of temperature is measured in each 360 second). MATLAB 7.8 software is used to develop NNs and SPSS 17 and CLEMENTINE 12 respectively are used to develop regression and regression tree models. hidden layer is tested to find best topology. After repeated trials, it was found that a network with one hidden layer consisting of 4 neurons in hidden layer for predicting heating time and a network with one hidden layer consisting of 4 neurons in hidden layer for predicting cooling time give a minimum ARRE on testing datasets. The sigmoid function is used as activation function of neurons in hidden layer and linear function as activation function of neurons in output layer. The values of ARRE for the test data set are shown in Table 2. Table 2. Statistical analysis of the performance of DM models for predicting heating and cooling times in annealing process using ARRE index (%) Data mining models AREE for predicting heating time AREE for predicting cooling time Regression model 2.93 % 2.18 % Regression tree model 3.6 % 3.2 % Neural network model 2.3 % 1.81 % It is can found that the lowest values of ARRE for predicting the heating and cooling times are 2.3% and 1.81% respectively, which shows that NN is more capable than regression and regression tree models. 4.2 Results of Trend Prediction of Coil Core Temperature In the presented method (in section III) for predicting of temperature trend of coil core, it is sufficient to predict polynomial coefficients. To model this process we selected the 4th degree of polynomial, the 4th degree is selected after some experiments on different degrees of polynomials. For predicting of these coefficients, feed forward NNs with BP learning algorithm are used. The sigmoid and linear functions were activation functions in hidden and output layers. Randomly 80% of datasets is selected for training and 20% of remained datasets for testing. The different kinds of topologies are tested and the best topologies based on ARRE error index on test datasets are shown in Table 3, 4. As we see in Table 3 the Error Index is acceptable. Table 3. The best topologies and statistical analysis of the performance of NNs for predicting of polynomial coefficients in heating phase using ARRE index. 4.1 Results of Heating and Cooling Times Prediction For training NN, regression and regression tree models, available datasets divided into two sets, 80% of the datasets randomly selected to train models, while the remained 20% used to test the ability of the trained models to predict heating and cooling times. Topologies contain 1-2 hidden layers and 1-20 neurons in each Network Topolog Y P1 P2 P3 P4 P5 Heatin g Time Numbe r of hidden layers 1 1 1 1 1 1 Numbe r of 10 7 9 4 9 4 neuron s in hidden layer Error Index Values of ARRE (%) 27.2 9 12. 8 2.6 3 2.6 8 1.2 6 2.3 Table 4. The best topologies and statistical analysis of the performance of NNs for predicting of polynomial coefficients in cooling phase using ARRE index. q1 Networ k topolog y Error index Numbe r of hidden layers 1 Numbe r of neurons in hidden layer 10 Values of ARRE (%) 17.6 2 q2 1 6 3. 4 q3 1 10 22. 1 q4 1 11 1.3 4 q5 1 Coolin g time annealing process were accurate enough, but while we use a larger training dataset accuracy of predictions will be improved. The presented method is applicable to predict the behaviour of processes that cannot be described by any analytical or physical equations. As some future works, we can compare other techniques of data mining such as different regressions, classification or clustering methods for this application. In addition the genetic algorithm can be applied to optimize the input parameters of annealing process for maximizing productivity of annealing operations. 6. REFERENCES [1] Soon Kyung Kim, Moon Kyung Kim, 1998, A Study on the Annealing Characteristics of BAF for Cold Rolled Steel Strip, KSME International journal, vol. 12, No. 2, pp. 330-337. [2] Meyer, U., and Woelk, G., 1974, Theoretical Fundamentals for the Development of a Mathematical Model of the TightCoil Bell-Type Furnace, Steel Research, vol. 45, no. 3, pp. 207–212. [3] Harvey, G. F., 1977, Mathematical Simulation of Tight Coil Annealing, The Journal of the Australasian Institute of Metals, vol. 22, no. 1, pp. 28–37. [4] Rovito, A. J., Aiello, W. M., and Voss, G. F., 1989, Computer-Based Models for Predicting End of Anneal Time at LTV, Iron and Steel Engineer, vol. 66, no. 7, pp. 35–40. [5] Rovito, A. J., Aiello, W. M., and Voss, G. F., 1991, Batch Anneal Coil Cold Spot Temperature Prediction Using Online Modeling at LTV, Iron and Steel Engineer ,vol. 68, no. 9, pp. 31–37. [6] Sahay, S.S., Kumar, A.M., Singh, S.B., Bhagat, A.N., Sharma, M.S.S., 2001, Development of an Integrated Batch Annealing Simulator for Tata Steel Cold Rolling Mill Complex, Tata Search, 39–46. [7] Pal, Deepankar , Datta, Amlan and Sahay, Satyam S, 2006, An Efficient Model for Batch Annealing Using a Neural Network, Materials and Manufacturing Processes, 21: 5, 567-572. [8] Piatetsky-Shapiro, G., 1999, The Data Mining Industry Coming of Age, IEEE Intell. Syst., 146, pp. 32–34. [9] Harding, J. A.,Shahbaz, M., Srinivas, Kusiak, A., 2006, Data mining in Manufacturing: a review, Journal of Manufacturing Science and Engineering,vol 128,PP 969-976. 1 3 4 2.9 5 1.81 Then trends of coil core temperature are obtained using the best obtained NNs based on the method presented in section 3.3. The RMSE error index is measured for all trends in heating and cooling phases. The mean of RMSE for predicted trends in heating and cooling phases are shown in table 5. Table 5. Statistical analysis of the performance of NNs for predicting of trends of coil core temperature in heating and cooling phases of annealing process using mean of RMSE index. Error index Error index for predicted trends in heating phase Error index for predicted trends in cooling phase Mean of RMSE 6.52 8.72 5. CONCLUSIONS In this study we proposed a method for modelling the annealing process by using data mining techniques. After testing different techniques of data mining, the feed forward back propagation neural network is selected to predict heating and cooling times and temperature of coil core during annealing process. The presented method can be used without much expertise in the area of metallurgy and mechanic and this is the main advantage of the method. The results of applying neural networks for modelling of [10] Sonford Weisberg, 2005, Applied Linear Regression, A John Wiley $ Sons. [11] Han, J., and Kamber, M, 2006, Data Mining: Concepts and Techniques, Morgan Kaufmann publisher. [12] Sohabhon B, Spethen OO, 1999, Application of ANN to forecast construction duration of buildings at the predesign stage, Journal of Construction Engineering and Management, 6(2):133–44. [13] Patterson DW. 1996, Artificial Neural Networks: Theory and Applications, London: Prentice-Hall. [14] Hassoun MH, 1995, Fundamentals of Artificial Neural Networks, Cambridge, MA: MIT Press.


