File
advertisement

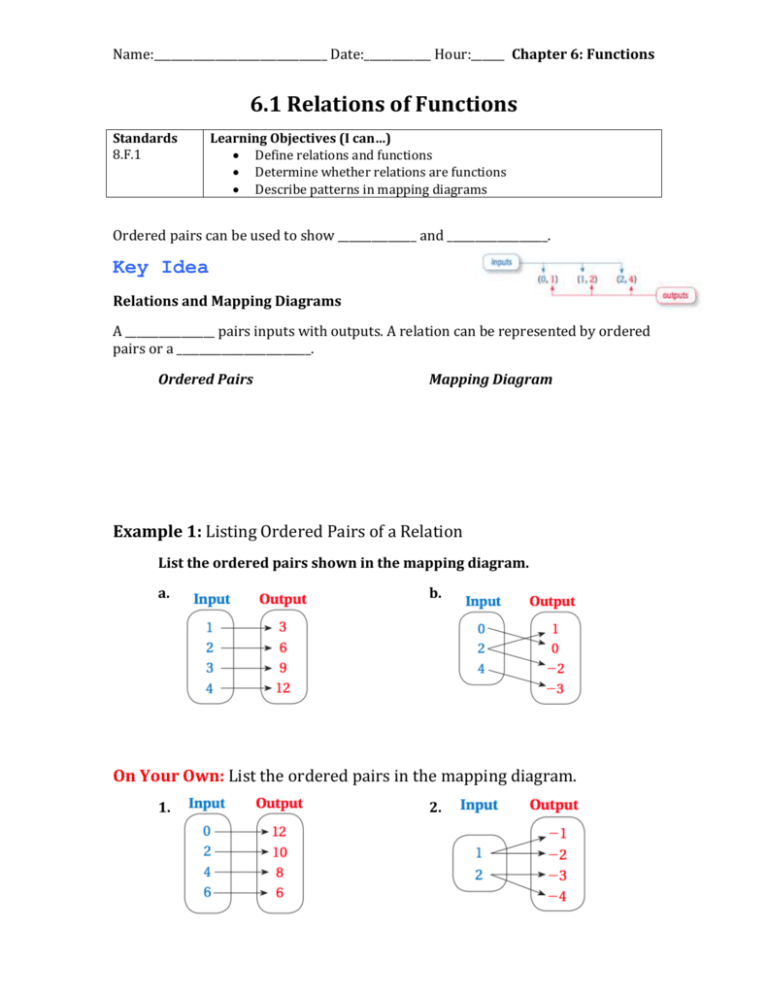
Name:_______________________________ Date:____________ Hour:______ Chapter 6: Functions 6.1 Relations of Functions Standards 8.F.1 Learning Objectives (I can…) Define relations and functions Determine whether relations are functions Describe patterns in mapping diagrams Ordered pairs can be used to show ______________ and __________________. Key Idea Relations and Mapping Diagrams A ________________ pairs inputs with outputs. A relation can be represented by ordered pairs or a ________________________. Ordered Pairs Mapping Diagram Example 1: Listing Ordered Pairs of a Relation List the ordered pairs shown in the mapping diagram. a. b. On Your Own: List the ordered pairs in the mapping diagram. 1. 2. Name:_______________________________ Date:____________ Hour:______ Chapter 6: Functions A relation that pairs each input with exactly one output is a ____________________. Example 2: Determining whether Relations are Functions Determine whether each relation is a function. a. b. Example 3: Describing a Mapping Diagram Consider the mapping diagram at the right. a. Determine whether the relation is a function. b. Describe the pattern of inputs and outputs in the mapping diagram On Your Own: Determine whether the relation is a function. 3. 4. 5. Describe the pattern of inputs and outs in problem 4. Name:_______________________________ Date:____________ Hour:______ Chapter 6: Functions 6.2 Representations of Functions Standards 8.F.1 Learning Objectives (I can…) Write function rules Use input-output tables Use graphs to represent functions Key Idea Functions as Equations A _______________________ is an equation that describes the relationship between inputs (independent variable) and outputs (dependent variable). Example 1: Writing Function Rules a. Write a function rule for “The output is five less than the input.” Words: Equation: b. Write a function rule for “The output is the square of the input.” Words: Equation: Example 2: Evaluating a Function What is the value of y 2 x 5 when x 3 . Name:_______________________________ Date:____________ Hour:______ Chapter 6: Functions On Your Own: 1. Write a function rule for “The output is one-fourth of the input.” Find the value a y when x 5 . 2. y 4 x 1 3. y 10 x 4. y 7 3x Key Idea Functions as Tables and Graphs A function can be represented by an _________________________________ and by a _______________. The table and graph below represent the function y x 2 . By drawing a line through the points, you graph all of the solutions of the function y x2. Example 3: Graphing a Function Graph the function y 2 x 1 using the inputs -1, 0, 1, and 2. Make an input-output table. Input, x 2x 1 Output, y Ordered Pair, (x,y) Name:_______________________________ Date:____________ Hour:______ Chapter 6: Functions Plot the ordered pairs and draw a line through the points On Your Own: Graph the Function 5. y x 1 6. y 3x 2 Example 4: Real-Life Application The number of pounds p of carbon dioxide produced by a car is 20 times the number of gallons g of gasoline used by the car. Write and graph a function that describes the relationship between p and g. Write a function rule using the variables g and p. Words: Equation: Make and input-output table that represents the function p 20 g . Input, g 20g Output, p Ordered Pair, (g,p) Name:_______________________________ Date:____________ Hour:______ Chapter 6: Functions Plot the ordered pairs and draw a line through the points. (Because you cannot have a negative number of gallons, use only positive values of g.) Summary Name:_______________________________ Date:____________ Hour:______ Chapter 6: Functions 6.3 Linear Functions Standards 8.F.2 8.F.3 8.F.4 Learning Objectives (I can…) Understand that the equation y=mx+b defines a linear equation Write linear functions using graphs or tables Compare linear functions A ______________________ is a function whose graph is a nonvertical line. A linear function can be written in the form _________________, where m is the slope and b is the y-intercept. Example 1: Writing a Linear Function Using a Graph Use the graph to write a linear function that relates y to x. Example 2: Writing a Linear Function Using a Table Use the table to write a linear function that relates y to x. Name:_______________________________ Date:____________ Hour:______ Chapter 6: Functions On Your Own: Use the graph or table to write a linear function that relates y to x. 1. 2. Example 3: Real-Life Application You are controlling an unmanned aerial vehicle for surveillance. The table shows the height y (in thousands of feet) of the UAV x minutes after you start its descent from cruising altitude. a. Write a linear function that relates y to x. Interpret the slope and the yintercept. b. Graph the linear function. c. Find the height of the UAV when you stop the descent after 1 hour. Name:_______________________________ Date:____________ Hour:______ Chapter 6: Functions Example 4: Comparing Linear Functions The earnings y (in dollars) of a nighttime employee working x hours are represented by the linear function y 7.5 x 30 . The table shows the earnings of a daytime employee. a. Which employee has a higher hourly wage? b. Write a linear function that relates the daytime employee’s earning to the number. Name:_______________________________ Date:____________ Hour:______ Chapter 6: Functions 6.4 Comparing Linear and Nonlinear Functions Standards 8.F.3 Learning Objectives (I can…) Identify linear and nonlinear functions from tables or graphs Compare linear and nonlinear functions The graph of a linear function shows a constant rate of change. A ______________________ does not have a constant rate of change. So, its graph is not a ___________________. Example 1: Identifying Functions from Tables Does the table represent a linear or nonlinear function? Explain. a. b. Example 2: Identifying Functions form Graphs Does the graph represent a linear or nonlinear function? Explain. a. b. Name:_______________________________ Date:____________ Hour:______ Chapter 6: Functions On Your Own: Does the table or graph represent a linear or nonlinear function? Explain. 1. 2. 3. Example 3: Identifying a Nonlinear Function Which equation represents a nonlinear function? Example 4: Real-Life Application Account A earns simple interest. Account B earns compound interest. The table shows the balance for 5 years. Graph the data and compare graphs. Name:_______________________________ Date:____________ Hour:______ Chapter 6: Functions 6.5 Analyzing and Sketching Graphs Standards 8.F.5 Learning Objectives (I can…) Analyze the relationship between two quantities using graphs Sketch graphs to represent the relationship between two quantities Graphs can show the relationship between quantities without using specific numbers on the axes. Example 1: Analyzing Graphs The graphs show the temperatures throughout the day in two cities. a. Describe the change in temperature in each city. Belfast: Newport: Name:_______________________________ Date:____________ Hour:______ Chapter 6: Functions b. Make three comparisons from the graphs 1. 2. 3. On Your Own: 1. The graphs show the paths of two birds diving to catch a fish. Describe the path of each bird. Pelican: Osprey: Example 2: Sketching Graphs Sketch a graph that represents each situation a. A stopped subway train gains speed at a constant rate until it reaches its maximum speed. It travels at this speed for a while, and then slows down at a constant rate until coming to a stop at the next station. Name:_______________________________ Date:____________ Hour:______ Chapter 6: Functions b. As television size increases, the price increases at an increasing rate. On Your Own: Sketch a graph that represents the situation. 2. A fully charged battery loses its charge at a constant rate until it has no charge left. You plug it in and recharge fully. Then it loses its charge at a constant rate until it has no charge left. 3. As the available quantity of a product increase, the price decreases at a decreasing rate.


