Notes for Quiz July 11
advertisement
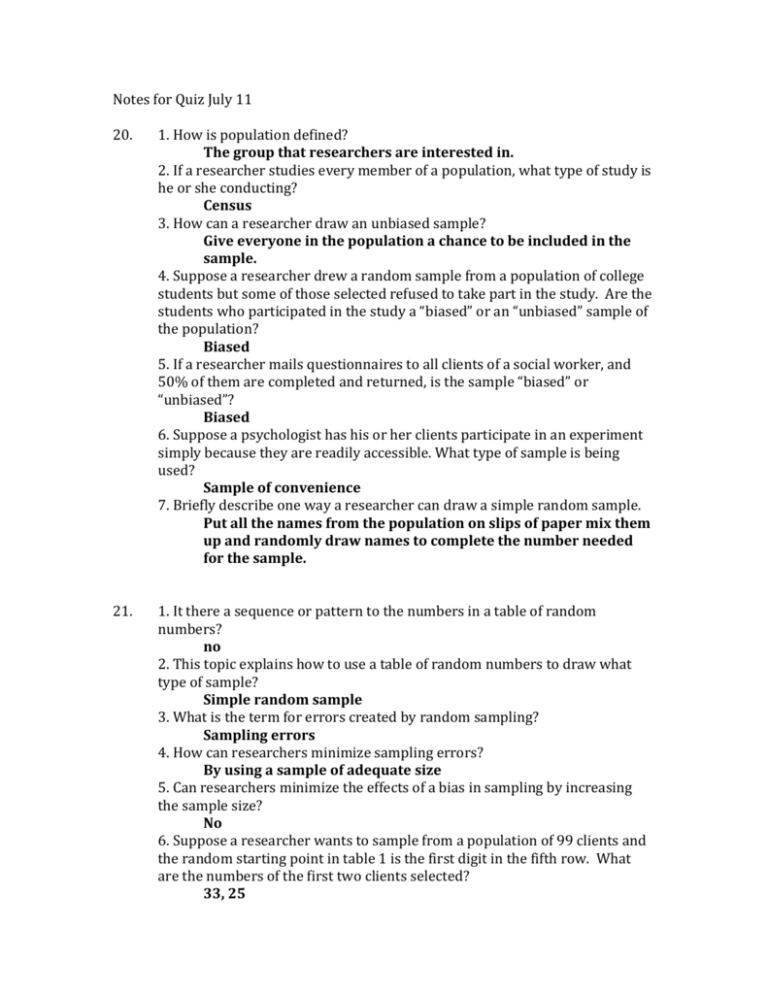
Notes for Quiz July 11 20. 1. How is population defined? The group that researchers are interested in. 2. If a researcher studies every member of a population, what type of study is he or she conducting? Census 3. How can a researcher draw an unbiased sample? Give everyone in the population a chance to be included in the sample. 4. Suppose a researcher drew a random sample from a population of college students but some of those selected refused to take part in the study. Are the students who participated in the study a “biased” or an “unbiased” sample of the population? Biased 5. If a researcher mails questionnaires to all clients of a social worker, and 50% of them are completed and returned, is the sample “biased” or “unbiased”? Biased 6. Suppose a psychologist has his or her clients participate in an experiment simply because they are readily accessible. What type of sample is being used? Sample of convenience 7. Briefly describe one way a researcher can draw a simple random sample. Put all the names from the population on slips of paper mix them up and randomly draw names to complete the number needed for the sample. 21. 1. It there a sequence or pattern to the numbers in a table of random numbers? no 2. This topic explains how to use a table of random numbers to draw what type of sample? Simple random sample 3. What is the term for errors created by random sampling? Sampling errors 4. How can researchers minimize sampling errors? By using a sample of adequate size 5. Can researchers minimize the effects of a bias in sampling by increasing the sample size? No 6. Suppose a researcher wants to sample from a population of 99 clients and the random starting point in table 1 is the first digit in the fifth row. What are the numbers of the first two clients selected? 33, 25 7. Suppose a researcher wants to sample from a population of 500 cilents and the random starting point in table 1 is the first digit in the fifth row. What are the number of the first two clients selected? 332, 170 8. If a researcher draws every other individual from a list of the population, he or she is using what type of sampling? Systematic sampling 9. What is the potential problem with systematic sampling? If the population is arranged in a way that allows for biasing (eg male/female/male/female) 10. How can a researcher get around the problem you named in the answer to question 9? By alphabetizing the sample 22. 1. To conduct a survey on a campus, a researcher drew a random sample of 25 class sections and contacted the instructors, who then administered the questionnaires in class. This researcher used what type of sampling? Cluster sampling 2. Which type of sampling is based on trust between participants and a researcher? Snowball sampling 3. what is a major drawback to cluster sampling? The results tend to be more homogeneous for the population as a whole 4. Which type of sampling is especially useful when attempting to locate participants who are hard to find? Snowball sampling 5. Briefly define purposive sampling. Watching a group of participants for an extended period of time and choosing those who are always on the “winning” side of the argument. 6. What must researchers do in cluster sampling to obtain an unbiased sample of clusters? Draw a large number of clusters and stratify based on geography. 7. Suppose a researcher has identified an individual who has engaged in an illegal activity to be a participant in a research project, and then the researcher identifies others who have engaged in the same activity through the first individual’s contacts. The researcher is using what type of sampling? Snowball sampling 24. 1. By collecting demographic information on the participants, a researcher can provide readers of the research with what? A picture of the types of persons who created the sample 2. Consider the demographic of marital status. Is this demographic likely to be equally relevant in all studies? No 3. A researcher can do what two things if he or she compares the demographics of a sample with its population and finds that a subgroup is underrepresented? First they could count the answers of the respondents who are underrepresented to achieve the same percentage. Second they can warn readers that the sample population does not match the demographics 4. According to this topic, is it important to compare the demographics of volunteers with the demographics of nonvolunteers? Yes, to account for biased results 5. What provides a unique opportunity for researchers who conduct mailed surveys to collect demographic information? Zip codes, higher vs. lower socioeconomic status 6. If some of the participants drop out of an experiment at midcourse, what is said to have occurred? Mortality 25. 1. Is sample size the primary consideration when judging the adequacy of a sample? No, an unbiased sample should be primary, sample size is secondary. 2. Does increasing sample size reduce bias? No, if the sample is biased to begin with increasing the sample will not decrease the bias. 3. Does increasing sample size increase precision? Yes, that is the benefit to research. 4. Researcher A increased his sample size from 200 to 250, and Researcher B increased her sample size from 1,000 to 1,050. Which researcher will get a biggest payoff in increased precision by adding 50 participants? Researcher A because their sample size increased with a greater percentage. 5. If a researcher uses a very large sample, is it still possible for the results to be wrong? Yes, if the sample was biased to begin with the results would be wrong. 6. Does each additional participant a researcher adds to a sample make an equal contribution to increasing precision? No, because of the principle of diminishing returns 7. According to the topic, prestigious national surveys are often conducted with about how many respondents? About 1,500 26. 1. What are pilot studies? Studies designed to get preliminary information on new treatments and instruments. 2. Do researchers usually use “small” or “large” samples in pilot studies? Small 3. If a researcher suspects that a trait is rare in a population, should he or she use a “small” or “large” sample to identify the incidence of the trait? Large 4. In what type of research might a researcher spend considerable amounts of time interacting with participants, and what effect might this have on sample size? Qualitative Research 5. Suppose a researcher suspects there is only a very small difference in math abilities of boys and girls at the sixth-grade level. Should the researcher use a “small” or “large” sample to measure this difference? Large 6. Suppose the population consists of church members in the Southern Baptist Convention. If a researcher believes the members of this population are very homogeneous in their belief in an afterlife, would it be acceptable to use a small sample to identify the percentage who hold such a belief? Small 7. According to Table 2 on page 201, if there is a population of 1,900 students in a school, what is the recommended sample size? 320 8. According to Table 2, if there are 130 nurses in a hospital, what is the recommended sample size? 97 9. What is the symbol for population size in Table 2? N 27. 1. What is the generic term for any type of measurement device? Instrument 2. An instrument is said to be valid to the extent that is does what? It measures what it is designed to measure. 3. Suppose a researcher purchases a commercial reading test that is highly valid for students who receive reading instruction that emphasizes phonics. Is it possible that the test is of limited validity for students who are taught with a method that does not emphasize phonics? Yes, because it could be elusive of other reading traits. 4. According to this topic, is it safe to say that no test is perfectly valid? Yes, it is the matter of degree to which it is valid. 5. Tapping only a sample of the behaviors underlying the constructs a researcher wants to measure has what effect on validity? Decreases the measure of validity. 6. If a trait is elusive, is it “easy” or “difficult” to measure with a high degree of validity? Difficult 28. 1. For which type of instrument is content validity essential? Achievement tests 2. Should researchers consider the types of skills required by achievement test items when judging content validity? Yes 3. To improve content validity, it is usually desirable to cover only a narrow sample of content from the broad content area to be covered by an achievement test. It this statement “true” or “false”? True 4. Is content validity relevant only to achievement tests? No, it can be used in other tests like self-concept 5. Which type of validity is based on superficial inspection? Face validity 6. Which two types of validity rely on judgments? Content validity and face validity 7. Is it possible for a test to have high face validity but low content validity? Yes, in the case of a drawing of one airplane, a plus sign, and two more airplanes. For a pilot, the drawings are relevant, but adding one and two is not 8. When might a researcher deliberately use an instrument with low face validity? When they want to conceal the purpose of the test. 29. 1. What is the term for the “standard” by which a test is judged? criterion 2. How is empirical defined in this topic? Relying on or based on observation rather than theory 3. What question does predictive validity answer? To what extent does the test predict the outcome it is supposed to predict. 4. If a test is perfectly valid, what value will its validity coefficient have? 1.00 5. In light of this topic, should a researcher be surprised to get a validity coefficient of .95 for a paper and pencil employment test when validated against supervisors’ job-performance ratings? No, because of human error and things that the paper and pencil test can not evaluate on the job 6. If a test has no validity whatsoever, what value will its validity coefficient have? 0.00 7. If a researcher collects the criterion data at about the same time the test is being administered, he or she is examining what type of empirical validity? Concurrent validity coefficient 30. 1. How is the term construct defined in this topic? A collection of related behaviors that are associated in a meaningful way 2. Is “fear” a construct? No, because it is not a collection of behaviors. 3. To determine construct validity, researchers begin by hypothesizing what? How the test relates to other variables 4. Does confirming a hypothesis in a construct validity study offer “direct” or “indirect” evidence on the validity of a test? Indirect 5. In Table 1, which two types of validity are classified as solely empirical? Predictive and Concurrent 6. In Table 1, which two types of validity are classified as solely judgmental? Content and Face 7. Why is construct validity identified as judgmental-empirical in this book? Because it requires judgments about the nature of relationships as well as empirical evidence about the instrument is consistent with the judgment 31. 1. A test is said to be reliable if it yields what? Consistent results 2. Should a researcher expect a very short multiple-choice test to be highly reliable? No, probability of getting the answers right by guessing are high 3. Is it possible for a test with high reliability to have low validity? Yes, if it covers the wrong content 4. Overall, is “validity” or “reliability” more important when evaluating an instrument? Validity is more important 5. If a test is highly reliable but highly invalid, is it useful? No, it must be reasonably reliable and reasonably valid 6. In light of this topic, should a researcher expect most tests to be both perfectly reliable and perfectly valid? No 7. Professional test makers tend to be more successful in achieving high validity than in achieving high reliability. Is this statement “true” or “false”? True, because they are not worried about content. 32. 1. Researchers need to use at least how many observers to determine interobserver reliability? two 2. When there are two quantitative scores per participant, researchers can compute what statistic to describe reliability? Correlation coefficient 3. Do researchers usually measure at two different points in time to estimate interobserver reliability? No, two researchers at the same time 4. Do researchers usually measure at two different points in time to estimate test-retest reliability? Yes 5. According to this topic, most published tests have reliability coefficients that are about how high? 0.80 6. According to this topic, serviceable reliability coefficients may be how low if researchers are examining group averages? 0.50 33. 1. Which two methods for estimating reliability require two testing sessions? Test-retest and parallel-forms 2. Does the split-half method require “one” or “two” administrations of a test? One 3. What is meant by an “odd-even split”? The researcher scores the odd and even questions on the test separately 4. If a split-half reliability coefficient equals 0.00, what does this indicate? The scores on odd numbered items have no relationship to the scores on even numbered items 5. What is the highest possible value for a split-half reliability coefficient? 1.00 6. To obtain alpha, mathematical procedures are used to obtain the equivalent of what? All possible split-half reliability coefficients 7. Does alpha estimate the consistency of scores over time? No, only at a single point in time 34. 1. A norm-referenced test is designed to facilitate a comparison of an individual’s performance with what? The performance of the norm group 2. Are norm groups always national samples? No, it could be a local population 3. What is the definition of a criterion-referenced test? A test designed to measure the extent to which individuals meet a performance standard 4. In which type of test are items answered correctly by about 50% of the participants favored in item selections? Norm-referenced Test 5. In which type of test are items typically selected on the basis of content they cover without regard to item difficulty? Criterion-referenced Test 6. Which type of test should be used in research where the purpose is to describe specifically what examinees can and cannot do? Criterion-referenced Test 35. 1. Which type of test is designed to predict achievement in general? Intelligence Test 2. An algebra prognosis test is an example of what type of test? Aptitude Test 3. A test designed to measure how much students learn in a particular course in school is what type of test? Achievement Test 4. A test designed to predict success in learning a new set of skills is what type of test? Aptitude Test 5. A list of desirable characteristics of a product or performance is known as what? Checklist 6. How can researchers increase the reliability of scoring essays, products and performances? By using common checklists and rating scales 7. According to this topic, are intelligence tests good measures of innate ability? No they are not because of racial and ethnic differences that are not accounted for on the test 8. According to this topic, how valid are commercially published aptitude tests? Low to modest validity about 0.20 to 0.60 43. 1. Which branch of statistics (inferential or descriptive) helps researchers to summarize data so they can be easily comprehended? Descriptive 2. According to Table 1 in this topic, how many participants had a score of 19? 9 3. What is the name of the statistic that describes how many participants per 100 have a certain characteristic? Percentages 4. Which branch of statistics helps researchers to draw inferences about the efforts of sampling errors on their results? Inferential 5. If a researcher tests a random sample instead of all members of a population, is it likely that the sample results will be the same as the results the researcher would have obtained by testing the population? No, random sampling produces sampling errors 6. Is a margin of error a “descriptive” or “inferential” statistic? Inferential 7. Are significance tests associated with “descriptive” or “inferential” statistics? Inferential 8. By studying populations, do researchers obtain “statistics” or “parameters”? Parameters 9. By studying samples, do researchers obtain “statistics” or “parameters”? Statistics 44. 1. How many explanations were there for the differences between psychologists and engineers in the example in this topic? Three 2. What does the null hypothesis say about sampling error? The population is underrepresented because of random sampling error 3. Does the term sampling error refer to “random errors” or to “bias”? random errors not bias (Version A) 4. The null hypothesis says the true difference equals what numerical value? The true difference equals 0 (Version C) 5. Significance tests are designed to determine the probabilities regarding the truth of what hypothesis? The null hypothesis 6. The expression p < .05 stands for what words? Probability is less than 5 in 100 7. Do researchers reject the null hypothesis when the probability of its truth is “high” or when the probability is “low”? Low 8. What do researchers do if the probability if greater than .05? They “fail to reject” the null hypothesis 9. What is an alternative way of saying a researcher has rejected the null hypothesis? Saying the difference is statistically significant 10. Are null hypotheses more likely to be explicitly stated in a “journal article” or in a “dissertation”? In a dissertation, the assumption is that it is known that the purpose for a significance test is to test the null hypothesis 45. 1. If a researcher asks participants to name the country in which they were born, the researcher is using which scale of measurement? Nominal 2. Which two scales of measurement have equal distances among the scores they yield? Interval and Ratio 3. If a researcher assigns a teacher to rank student according to their oral-language skills, the researchers is using which scale of measurement? Ordinal 4. Which scale of measurement has an absolute zero? Ratio 5. Which scale of measurement is at the lowest level? Nominal 6. Objective, multiple-choice achievement tests are usually assumed to measure at what level? Interval 7. If a researcher measures in such a way that he or she finds out which participant is the most honest, which is the next most honest, and so on (without measuring to determine how much honesty each one has), the researcher is measuring with what scale of measurement? Ordinal 8. The number of minutes of overtime work that employees perform is an example of which scale of measurement? Ratio 9. Weight measured in pounds is an example of which scale of measurement? Ratio 49. 1. According to figure 1 how many participants had a score of 16? ~55 2. In figure 1, are the frequencies on the “vertical” or the “horizontal” axis? Vertical 3. What is the name of the curve that is symmetrical? Bell curve 4. If a distribution has some extreme scores on the right (but not the left), it is said to have what type of skew? Positive skew 5. If a distribution is skewed to the left, does it have a “positive” or a “negative” skew? Negative 6. In most populations, income has what type of skew? Positive 7. Does a distribution with a tail to the right have a “positive” or “negative” skew? Positive 50. 1. Which average is defined as the most frequently occurring score? Mode 2. Which average is defined as the balance point in a distribution? Mean 3. Which average is defined as the middle score? Median 4. What is the formal definition of the mean? The value around which the deviations sum to zero 5. How is the mean calculated? Add up the scores and divide by the number of scores 6. Should the mean be used for highly skewed distributions? No, it causes the mean to change drastically 7. Should the median be used for highly skewed distributions? Yes 8. Which one of the three averages is very seldom used in formal reports of research? Mode 9. What is a synonym for the term averages? Measures of central tendency 51. 1. Which average is usually reported when standard deviation is reported? Mean 2. What is meant by the term variability? The amount in which participants differ from one another 3. Is it possible for two groups to have the same mean but different standard deviations? Yes 4. If all individuals in a group have the same score, what is the value of the standard deviation for the scores? 0 5. What percentage of the participants lies within one standarddeviation unit of the mean in a normal distribution? 68% 6. The middle 68% of the participants in a normal distribution have scores between what two values if the mean equals 100 and the standard deviation equals 15? 85 and 115 7. If the mean of a normal distribution equals 50 and the standard deviation equals 5, what percentage of the participants have scores between 45 and 50? 34% 8. Does the 68% rule strictly apply if a distribution is not normal? No it only applies if the distribution is normal 9. If the standard deviation for Group X is 14.55 and the standard deviation for Group Y is 20.99, which group has less variability in its scores? Group X 10. Refer to Question 9. Does Group X or Group Y have a narrower curve? Group X


