Common Core Algebra I Unit 1 Starting Points
advertisement
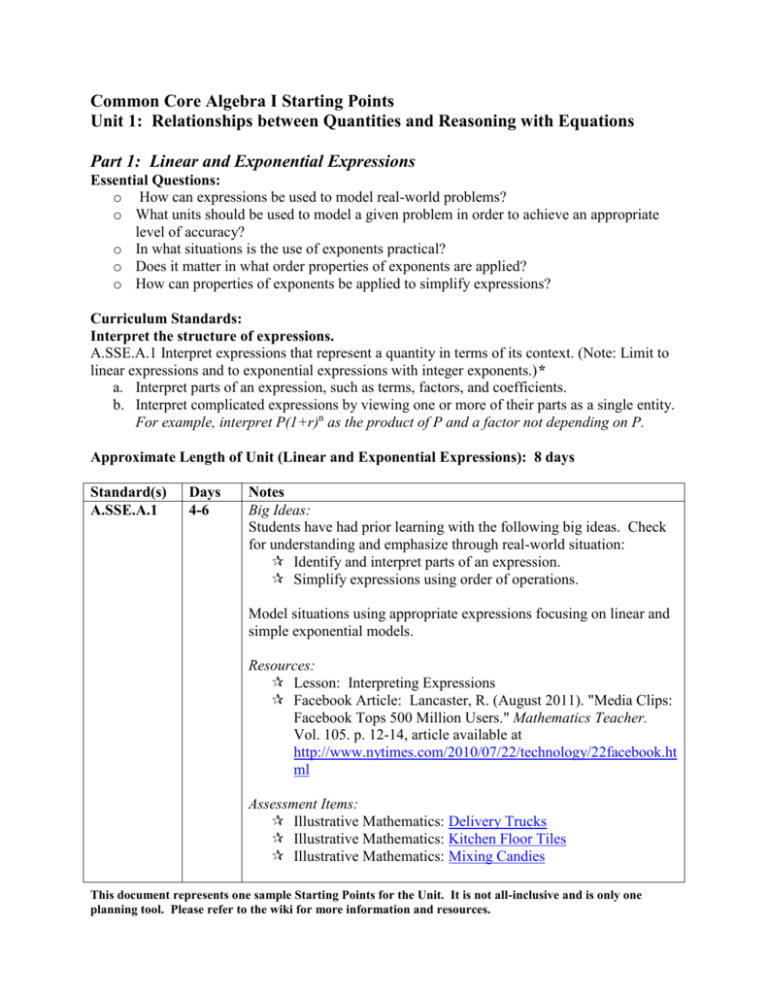
Common Core Algebra I Starting Points Unit 1: Relationships between Quantities and Reasoning with Equations Part 1: Linear and Exponential Expressions Essential Questions: o How can expressions be used to model real-world problems? o What units should be used to model a given problem in order to achieve an appropriate level of accuracy? o In what situations is the use of exponents practical? o Does it matter in what order properties of exponents are applied? o How can properties of exponents be applied to simplify expressions? Curriculum Standards: Interpret the structure of expressions. A.SSE.A.1 Interpret expressions that represent a quantity in terms of its context. (Note: Limit to linear expressions and to exponential expressions with integer exponents.)* a. Interpret parts of an expression, such as terms, factors, and coefficients. b. Interpret complicated expressions by viewing one or more of their parts as a single entity. For example, interpret P(1+r)n as the product of P and a factor not depending on P. Approximate Length of Unit (Linear and Exponential Expressions): 8 days Standard(s) A.SSE.A.1 Days 4-6 Notes Big Ideas: Students have had prior learning with the following big ideas. Check for understanding and emphasize through real-world situation: Identify and interpret parts of an expression. Simplify expressions using order of operations. Model situations using appropriate expressions focusing on linear and simple exponential models. Resources: Lesson: Interpreting Expressions Facebook Article: Lancaster, R. (August 2011). "Media Clips: Facebook Tops 500 Million Users." Mathematics Teacher. Vol. 105. p. 12-14, article available at http://www.nytimes.com/2010/07/22/technology/22facebook.ht ml Assessment Items: Illustrative Mathematics: Delivery Trucks Illustrative Mathematics: Kitchen Floor Tiles Illustrative Mathematics: Mixing Candies This document represents one sample Starting Points for the Unit. It is not all-inclusive and is only one planning tool. Please refer to the wiki for more information and resources. A.SSE.A.1 Use laws of exponents to simplify an expression. (Students learned this in Common Core 8. Pre-assess and review as needed.) 2-4 Part 2: Relationships in One Variable Essential Questions: o Can the structure of a linear equation or inequality be used to devise a plan for solving the equation or inequality in the context? o How can mathematical properties be correctly applied when solving one-variable equations and inequalities? o Can a solution or solution set and the method by which the solution was obtained be justified using the language of mathematics? o What does a solution or solution set mean in the context of the problem situation? o How can mathematical properties be correctly applied in order to solve literal equations and formulas for a given variable? Curriculum Standards: Create equations that describe numbers or relationships. A.CED.A.1 Create equations and inequalities in one variable and use them to solve problems. Limit to linear equations and inequalities. Understand solving equations as a process of reasoning and explain the reasoning. A.REI.A.1 Explain each step in solving a linear equation as following from the equity of numbers asserted at the previous step, starting from the assumption that the original equation has a solution. Construct a viable argument to justify a solution method. Solve equations and inequalities in one variable. A.REI.B.3 Solve linear equations and inequalities in one variable, including equations with coefficients represented by letters. Create equations that describe numbers or relationships. A.CED.A.4 Rearrange linear formulas to highlight a quantity of interest, using the same reasoning as in solving equations. Approximate Length of Unit (Relationships in One Variable): 8 days Standard(s) A.REI.A.1 A.CED.A.1 A.REI.B.3 N.Q.A.2 N.Q.A.3 Days 4-6 Notes Big Ideas: Students will have solved linear equations using algebraic properties in their previous courses. Pre-Assess student understanding and review as needed. Real-world scenarios and multiple representations should be the focus for these days. Resources: This document represents one sample Starting Points for the Unit. It is not all-inclusive and is only one planning tool. Please refer to the wiki for more information and resources. Lesson: Solving Equations with Algebra Tiles Lesson: Scales of Equality Lesson: Solving Inequalities Task: Setting the Table Web Resource: “Sherlock Bones” Forensic Anthropology Activity Web Resource: Algebra Balance Assessment Items: Illustrative Mathematics: How does the solution change? Illustrative Mathematics: Same solutions? Illustrative Mathematics: Paying the Rent Illustrative Mathematics: Planes and Wheat Illustrative Mathematics: Sums of Angles in a Polygon Illustrative Mathematics: Harvesting Fields Assessment Limit/Clarification: Limited to linear, quadratic, or exponential with integer exponents. These standards are revisited in later units, as well. A.CED.A.4 N.Q.A.1 2-3 Big Ideas: Rearrange formulas and literal equations to highlight variables/quantities of interest. Resources: Lesson: Homecoming Activity Lesson Seed: Backpacking in Europe Assessment Items: Illustrative Mathematics: Equations and Formulas Part 3: Relationships in Two Variables Essential Questions: o Is the given relationship a function? Why or why not? o For what situations is function notation useful? o When is it appropriate to restrict the domain? o How can a linear function be created, using function notation, to represent the relationship between the two quantities given? o What representations can be created that will portray the solution set to a linear function? By what methods can these representations be created? o What units, scales and labels must be applied to accurately represent a linear function in the context of a problem situation? This document represents one sample Starting Points for the Unit. It is not all-inclusive and is only one planning tool. Please refer to the wiki for more information and resources. o What are the advantages of representing the relationship between quantities symbolically? Numerically? Graphically? o Which representation is best applied to the real-life scenario, and what constraints does this representation have? Curriculum Standards: Understand the concept of a function and use function notation. F.IF.A.1 Understanding that a function from one set (called the domain) to another set (called the range) assigns to each element of the domain exactly one element of the range. If f is a function and x is an element of its domain, then f(x) denotes the output of f corresponding to the input x. The graph of f is the graph of the equation y = f(x).* F.IF.A.2 Use function notation, evaluate functions for inputs in their domains, and interpret statements that use function notation in terms of a context. Create equations that describe numbers or relationships. A.CED.A.2 Create linear equations to represent relationships between quantities; graph equations on coordinate axes with labels and scales. Represent and solve equations and inequalities graphically. A.REI.D.10 Understand that the graph of an equation in two variables is the set of all its solutions plotted in the coordinate plane, often forming a curve (which could be a line). A.CED.A.3 Represent constraints by linear equations or inequalities, and by systems of linear equations and/or inequalities, and interpret solutions as viable or non-viable options in a modeling context. For example, represent inequalities describing nutritional and cost constraints on combinations of different foods. Approximate Length of Unit (Relationships in Two Variables): 10 days Standard(s) F.IF.A.1 F.IF.A.2 N.Q.A.1 Days 2 Notes Big Ideas: Determine whether or not a relationship is a function Determine the domain and range for a function Identify key features of a function (maximum, minimum, roots, continuous) Understand and use function notation to represent a relationship Resources: Lesson: Function Notation Lesson: Function Notation and Flying T-Shirts Assessment Items: Illustrative Mathematics: Points on a Graph This document represents one sample Starting Points for the Unit. It is not all-inclusive and is only one planning tool. Please refer to the wiki for more information and resources. Illustrative Mathematics: The Customers Illustrative Mathematics: Cell Phones Illustrative Mathematics: Yam in the Oven A.CED.A.2 N.Q.A.1 3 Big Ideas: Create and graph linear equations and inequalities Resources: Lesson: Dinner Party Task: Peak Hear Rates Web Lesson: Phone Bill Lesson Web Resource: Triangles Applet Assessment Items: Illustrative Mathematics: How Much Folate? Illustrative Mathematics: Clea on an Escalator A.REI.D.10 A.CED.3 N.Q.A.2 N.Q.A.3 5 Big Ideas: Understand the graph of an equation in two variables is the set of all its solutions Represent constraints by linear equations/inequalities and by systems of linear equations/inequalities in a modeling context o Systems will be revisited in Unit 2 Determine whether a solution is viable based on the context of the problem Resources: Lesson: Graphs and Tables Web Resource: Getting out of Line Lesson Web Resource: Hot Dog Sales Lesson Task: Starting a Skateboard Business Task: How much dog food? Assessment Items: Illustrative Mathematics: Taxi! Illustrative Mathematics: Dimes and Quarters Illustrative Mathematics: Growing Coffee Illustrative Mathematics: Writing Constraints Howard County Public Schools Office of Secondary Mathematics Curricular Projects has licensed this product under a Creative Commons Attribution-NonCommercial-NoDerivs 3.0 Unported License. This document represents one sample Starting Points for the Unit. It is not all-inclusive and is only one planning tool. Please refer to the wiki for more information and resources.

