Supplementary Information (docx 252K)
advertisement

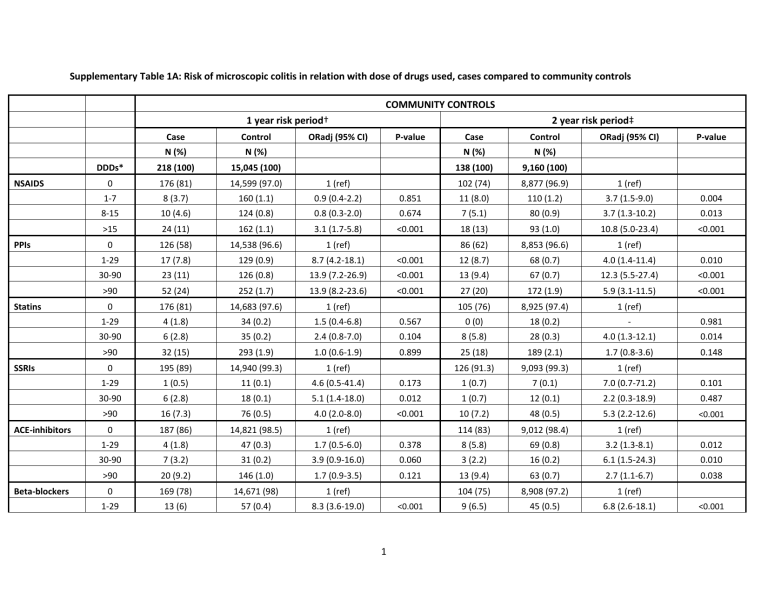
Supplementary Table 1A: Risk of microscopic colitis in relation with dose of drugs used, cases compared to community controls COMMUNITY CONTROLS 1 year risk period† NSAIDS PPIs Statins SSRIs ACE-inhibitors Beta-blockers 2 year risk period‡ Case Control Case Control N (%) N (%) ORadj (95% CI) P-value N (%) N (%) DDDs* 218 (100) 15,045 (100) 138 (100) 9,160 (100) 0 176 (81) 14,599 (97.0) 1 (ref) 102 (74) 8,877 (96.9) ORadj (95% CI) P-value 1 (ref) 1-7 8 (3.7) 160 (1.1) 0.9 (0.4-2.2) 0.851 11 (8.0) 110 (1.2) 3.7 (1.5-9.0) 0.004 8-15 10 (4.6) 124 (0.8) 0.8 (0.3-2.0) 0.674 7 (5.1) 80 (0.9) 3.7 (1.3-10.2) 0.013 >15 24 (11) 162 (1.1) 3.1 (1.7-5.8) <0.001 18 (13) 93 (1.0) 10.8 (5.0-23.4) <0.001 0 126 (58) 14,538 (96.6) 1 (ref) 86 (62) 8,853 (96.6) 1 (ref) 1-29 17 (7.8) 129 (0.9) 8.7 (4.2-18.1) <0.001 12 (8.7) 68 (0.7) 4.0 (1.4-11.4) 0.010 30-90 23 (11) 126 (0.8) 13.9 (7.2-26.9) <0.001 13 (9.4) 67 (0.7) 12.3 (5.5-27.4) <0.001 >90 52 (24) 252 (1.7) 13.9 (8.2-23.6) <0.001 27 (20) 172 (1.9) 5.9 (3.1-11.5) <0.001 0 176 (81) 14,683 (97.6) 1 (ref) 105 (76) 8,925 (97.4) 1 (ref) 1-29 4 (1.8) 34 (0.2) 1.5 (0.4-6.8) 0.567 0 (0) 18 (0.2) - 0.981 30-90 6 (2.8) 35 (0.2) 2.4 (0.8-7.0) 0.104 8 (5.8) 28 (0.3) 4.0 (1.3-12.1) 0.014 >90 32 (15) 293 (1.9) 1.0 (0.6-1.9) 0.899 25 (18) 189 (2.1) 1.7 (0.8-3.6) 0.148 0 195 (89) 14,940 (99.3) 1 (ref) 126 (91.3) 9,093 (99.3) 1 (ref) 1-29 1 (0.5) 11 (0.1) 4.6 (0.5-41.4) 0.173 1 (0.7) 7 (0.1) 7.0 (0.7-71.2) 0.101 30-90 6 (2.8) 18 (0.1) 5.1 (1.4-18.0) 0.012 1 (0.7) 12 (0.1) 2.2 (0.3-18.9) 0.487 >90 16 (7.3) 76 (0.5) 4.0 (2.0-8.0) <0.001 10 (7.2) 48 (0.5) 5.3 (2.2-12.6) <0.001 0 187 (86) 14,821 (98.5) 1 (ref) 114 (83) 9,012 (98.4) 1 (ref) 1-29 4 (1.8) 47 (0.3) 1.7 (0.5-6.0) 0.378 8 (5.8) 69 (0.8) 3.2 (1.3-8.1) 0.012 30-90 7 (3.2) 31 (0.2) 3.9 (0.9-16.0) 0.060 3 (2.2) 16 (0.2) 6.1 (1.5-24.3) 0.010 >90 20 (9.2) 146 (1.0) 1.7 (0.9-3.5) 0.121 13 (9.4) 63 (0.7) 2.7 (1.1-6.7) 0.038 0 169 (78) 14,671 (98) 1 (ref) 104 (75) 8,908 (97.2) 1 (ref) 1-29 13 (6) 57 (0.4) 8.3 (3.6-19.0) 9 (6.5) 45 (0.5) 6.8 (2.6-18.1) <0.001 1 <0.001 30-90 10 (4.6) 94 (0.6) 2.7 (1.2-6.2) 0.017 7 (5.1) 51 (0.6) 2.3 (0.8-6.9) 0.123 >90 26 (12) 223 (1.5) 1.6 (0.8-3.0) 0.168 18 (13) 156 (1.7) 1.9 (0.9-4.2) 0.099 *DDDs, defined daily doses. The DDD is the assumed average maintenance dose per day for a drug used for its main indication in adults. # Adjusted for concomitant use of NSAIDs, PPIs, statins, SSRIs, low-dose aspirin, ACE-inhibitors and beta-blockers. † 1 year risk period (A): Odds ratios from the analysis with a 1 year risk period assessment available. See Figure 1, risk period (A). ‡ 2 year risk period (B): Odds ratios from the analysis with 2 year valid data available, but excluding the 1 year prior to index date, thus including a 1 year lag-time. See Figure 1, risk period (B). 2 Supplementary Table 1B: Risk of microscopic colitis in relation with dose of drugs used, cases compared to colonoscopy controls COLONOSCOPY CONTROLS 1 year risk period† NSAIDS PPIs Statins SSRIs ACE-inhibitors Beta-blockers Case Control N (%) DDDs* ORadj (95% CI) 2 year risk period‡ P-value Case Control ORadj (95% CI) P-value N (%) N (%) N (%) 148 (100) 475 (100) 95 (100) 296 (100) 0 121 (82) 455 (95.8) 1 (ref) 68 (72) 282 (95.3) 1 (ref) 1-7 5 (3.4) 7 (1.5) 1.9 (0.4-9.6) 0.464 8 (8.4) 6 (2.0) 2.7 (0.5-13.4) 0.229 8-15 6 (4.1) 8 (1.7) 0.6 (0.1-3.8) 0.578 6 (6.3) 2 (0.7) - 0.989 >15 16 (11) 5 (1.1) 3.6 (0.7-19.2) 0.131 13 (14) 6 (2.0) 5.7 (1.3-25.4) 0.024 0 83 (56) 441 (92.8) 1 (ref) 57 (60) 285 (96.3) 1 (ref) 1-29 12 (8.1) 5 (1.1) 1.9 (0.4-9.3) 0.454 11 (12) 5 (1.7) 6.9 (1.1-42.9) 0.040 30-90 20 (14) 11 (2.3) 10.9 (3.0-40.1) <0.001 8 (8.4) 1 (0.3) - 0.991 >90 33 (22) 18 (3.8) 11.7 (3.4-41.1) <0.001 19 (20) 5 (1.7) 4.3 (1.0-17.7) 0.045 0 120 (81) 455 (95.8) 1 (ref) 74 (78) 284 (95.9) 1 (ref) 1-29 4 (2.7) 0 (0) - 0.985 0 (0) 0 (0) - 30-90 3 (2) 4 (0.8) 2.1 (0.2-20.6) 0.511 3 (3.2) 0 (0) - >90 21 (14) 16 (3.4) 0.5 (0.1-2.7) 0.396 18 (19) 12 (4.1) 1.4 (0.26-6.95) 0 131 (89) 475 (100) 1 (ref) 86 (91) 296 (100) 1 (ref) 1-29 1 (0.7) 0 (0) - 1 (1.1) 0 (0) - 30-90 4 (2.7) 0 (0) - 0 (0) 0 (0) - >90 12 (8.1) 0 (0) - 8 (8.4) 0 (0) - 0 126 (85) 457 (96.2) 1 (ref) 78 (82) 286 (96.6) 1 (ref) 0.722 1-29 4 (2.7) 14 (2.9) - 4 (4.2) 1 (0.3) - 30-90 7 (4.7) 0 (0) - 2 (2.1) 0 (0) - >90 11 (7.4) 4 (0.8) 15.6 (1.8-132.7) 11 (12) 9 (3) 1.6 (0.2-12.9) 0 117 (79) 467 (98.3) 1 (ref) 72 (76) 290 (98.0) 1 (ref) 1-29 7 (4.7) 2 (0.4) 5.9 (0.7-51.9) 0.111 5 (5.3) 2 (0.7) 8.5 (0.9-84.1) 0.068 30-90 7 (4.7) 3 (0.6) 5.9 (0.4-87.7) 0.198 5 (5.3) 3 (1) 0.5 (0.03-6.9) 0.565 0.012 3 0.640 >90 17 (11) 3 (0.6) 1.8 (0.3-11.4) 0.531 13 (14) 1 (0.3) 4.3 (0.4-49.1) 0.243 *DDDs, defined daily doses. The DDD is the assumed average maintenance dose per day for a drug used for its main indication in adults. # Adjusted for concomitant use of NSAIDs, PPIs, statins, SSRIs, low-dose aspirin, ACE-inhibitors and beta-blockers. † 1 year risk period (A): Odds ratios from the analysis with a 1 year risk period assessment available. See Figure 1, risk period (A). ‡ 2 year risk period (B): Odds ratios from the analysis with 2 year valid data available, but excluding the 1 year prior to index date, thus including a 1 year lag-time. See Figure 1, risk period (B). 4 A Supplementary Figure 1A and 1B: Risk of microscopic colitis compared to community and colonoscopy controls in risk period 1 year prior to index date (risk period A). # Adjusted for concomitant use of NSAIDs, PPIs, statins, SSRIs, low-dose aspirin, ACEinhibitors, beta-blockers; celiac disease; inflammatory bowel disease; hypothyroid disease; polyarthritis; rheumatoid arthritis and type 2 diabetes mellitus. Risk period (A): Odds ratios from the analysis 1 year prior to index date. See Figure 1, risk period (A). Mo, months; SSRIs, selective serotonin reuptake inhibitors. Current use (<3 mo) Statins Community controls Colonoscopy controls Current use (<3 mo) Past use (3-12 mo) Past use (3-12 mo) Current use (<3 mo) PPIs Current use (<3 mo) Past use (3-12 mo) Past use (3-12 mo) Current use (<3 mo) Current use (<3 mo) NSAIDs Past use (3-12 mo) Past use (3-12 mo) 0 10 20 30 90 92 94 96 98 100 Adjusted Odds Ratio (95% CIs) B Current use (< 3 mo) Beta- Current use (< 3 mo) blockers Past use (3-12 mo) Community controls Colonoscopy controls Past use (3-12 mo) Current use (< 3 mo) ACECurrent use (< 3 mo) inhibitors Past use (3-12 mo) Past use (3-12 mo) Current use (< 3 mo) Low-dose Current use (< 3 mo) Aspirin Past use (3-12 mo) Past use (3-12 mo) Current use (< 3 mo) SSRIs Current use (< 3 mo) Past use (3-12 mo) Past use (3-12 mo) 0 10 20 Adjusted Odds Ratio (95% CIs) 5 30 160 162 164 166 168 170 A Supplementary Figure 2A and 2B: Risk of microscopic colitis compared to community and colonoscopy controls in risk period within 2 years before index date, while excluding the 1 year prior to index date (risk period B). Community controls Colonoscopy controls Current use (< 3 mo) Statins Current use (< 3 mo) Past use (3-12 mo) Past use (3-12 mo) Current use (< 3 mo) # Adjusted for concomitant use of NSAIDs, PPIs, statins, SSRIs, low-dose aspirin, ACE-inhibitors, beta-blockers; celiac disease; inflammatory bowel disease; hypothyroid disease; polyarthritis; rheumatoid arthritis and type 2 diabetes mellitus. Risk period (B): Odds ratios from the analysis within 2 years before index date while excluding the year prior to index date. See Figure 1, risk period (B). Mo, months; SSRIs, selective serotonin re-uptake inhibitors. PPIs Current use (< 3 mo) Past use (3-12 mo) Past use (3-12 mo) Current use (< 3 mo) Current use (< 3 mo) NSAIDs Past use (3-12 mo) Past use (3-12 mo) 0 B 10 20 30 120 122 124 126 128 130 Adjusted Odds Ratio (95% CIs) Current use (< 3 mo) Betablockers Current use (< 3 mo) Past use (3-12 mo) Past use (3-12 mo) Current use (< 3 mo) ACEinhibitors Current use (< 3 mo) Past use (3-12 mo) Past use (3-12 mo) Current use (< 3 mo) Community controls Colonoscopy controls Current use (< 3 mo) SSRIs Past use (3-12 mo) Past use (3-12 mo) 0 10 20 Adjusted Odds Ratio (95% CIs) 6 30 70 72 74 76 78 80 A) Risk Period A) 1 year exposure period Supplementary Figure 3A and 3B: Risk of Microscopic colitis for individual types of NSAIDs, cases compared to community and colonoscopy controls. Community controls Colonoscopy controls Celecoxib Celecoxib Diclofenac Diclofenac Etoricoxib Etoricoxib Ibuprofen Ibuprofen Naproxen Naproxen Combination of NSAIDs Combination of NSAIDs 0 5 10 15 Adjusted Odds Ratio (95% CIs) Test for heterogeneity p=0.1179 B) Risk Period B) 2 year exposure period excluding the year prior to index date Celecoxib Celecoxib Diclofenac Diclofenac Etoricoxib Etoricoxib Ibuprofen Ibuprofen Naproxen Naproxen Combination of NSAIDs Combination of NSAIDs 7 0 Test for heterogeneity p=0.3113 5 10 15 Adjusted Odds Ratio (95% CIs) 20 70 71 72 73 74 75 Community controls Colonoscopy controls A) Risk Period A) 1 year exposure period Community controls Colonoscopy controls Esomeprazole Supplementary Figure 4A and 4B: Risk of Microscopic colitis for individual types of PPIs, cases compared to community and colonoscopy controls. Esomeprazole Omeprazole Omeprazole Pantoprazole Pantoprazole Rabeprazole Rabeprazole Combination of PPIs Combination of PPIs 0 20 40 B) 60 90 100 110 120 130 Adjusted Odds Ratio (95% CIs) Test for heterogeneity p=0.9819 Test for heterogeneity p=0.0622 Risk Period B) 2 year exposure period excluding the year prior to index date Esomeprazole Esomeprazole Omeprazole Omeprazole Pantoprazole Pantoprazole Combination of PPIs Combination of PPIs 0 10 Test for heterogeneity p=0.9597 Test for heterogeneity p=0.022 8 20 Adjusted Odds Ratio (95% CIs) 30 300 302 304 306 308 310 Community controls Colonoscopy controls


