S1 Table - figshare
advertisement
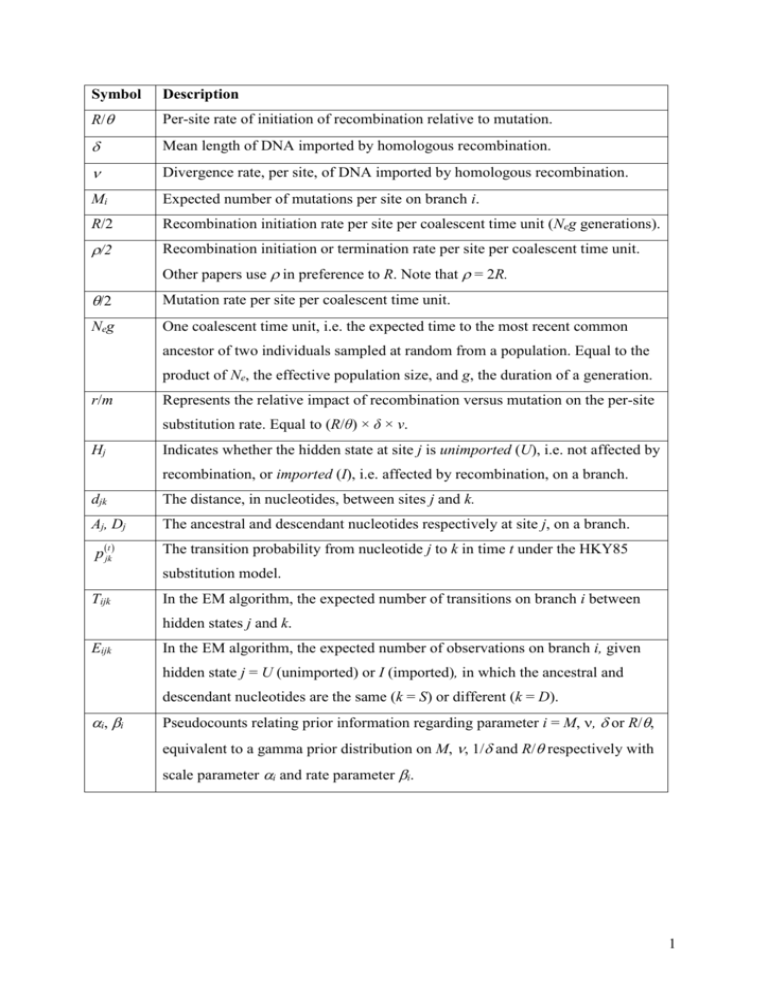
Symbol Description R/ Per-site rate of initiation of recombination relative to mutation. Mean length of DNA imported by homologous recombination. Divergence rate, per site, of DNA imported by homologous recombination. Mi Expected number of mutations per site on branch i. R/2 Recombination initiation rate per site per coalescent time unit (Neg generations). /2 Recombination initiation or termination rate per site per coalescent time unit. Other papers use in preference to R. Note that = 2R. /2 Mutation rate per site per coalescent time unit. Neg One coalescent time unit, i.e. the expected time to the most recent common ancestor of two individuals sampled at random from a population. Equal to the product of Ne, the effective population size, and g, the duration of a generation. r/m Represents the relative impact of recombination versus mutation on the per-site substitution rate. Equal to (R/θ) × δ × ν. Hj Indicates whether the hidden state at site j is unimported (U), i.e. not affected by recombination, or imported (I), i.e. affected by recombination, on a branch. djk The distance, in nucleotides, between sites j and k. Aj, Dj The ancestral and descendant nucleotides respectively at site j, on a branch. p(jkt) The transition probability from nucleotide j to k in time t under the HKY85 substitution model. Tijk In the EM algorithm, the expected number of transitions on branch i between hidden states j and k. Eijk In the EM algorithm, the expected number of observations on branch i, given hidden state j = U (unimported) or I (imported), in which the ancestral and descendant nucleotides are the same (k = S) or different (k = D). i, i Pseudocounts relating prior information regarding parameter i = M, , or R/, equivalent to a gamma prior distribution on M, , 1/ and R/ respectively with scale parameter i and rate parameter i. 1
