Solubility Notes
advertisement
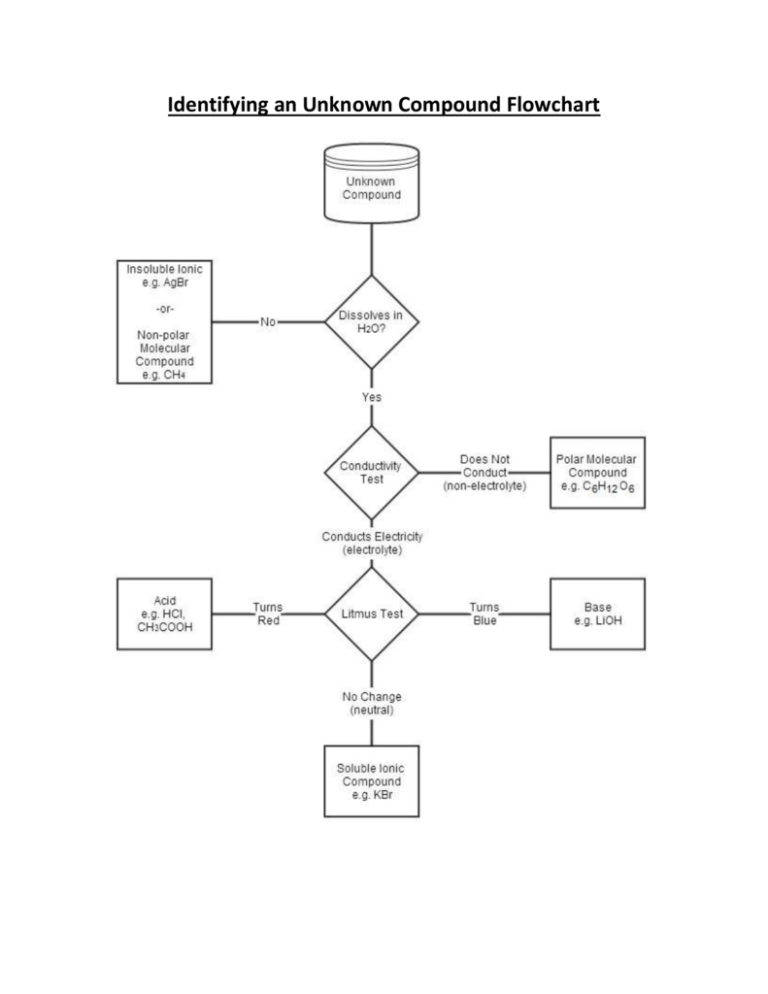
Identifying an Unknown Compound Flowchart Solubility in Water Generalizations Solids -Solids usually have ________________ solubility in water at _______________ temperatures. -For example, lithium bromide has a solubility of 143 g/100 mL at 0oC, and a solubility of 266 g/100 ml at 100oC Gases -Gases always have _________________solubility in water at lower temperatures. -The solubility of gas ________________ as the temperature increases. -Gases always have _________________solubility in water at _______________ pressures. Liquids -It is difficult to generalize about the effect on the solubility of liquids in water. -For polar liquids in water, the solubility usually increases with temperature -Some liquids (mostly non-polar liquids) do not dissolve in water but form a separate layer. Liquids that behave this way are said to be ________________ with water. -Some liquids (mostly small polar molecules with hydrogen bonding) dissolve completely in water in any proportion. These liquids are said to be ________________ with water. Elements -Elements generally have very ______________ solubility in water. Assignment: Investigating the Relationship between Solubility and Temperature For this assignment we will look at the solubility of two different chemicals at various temperatures to evaluate the accuracy of our generalizations. We will construct a graph that compares the solubility of potassium nitrate in water with the solubility of hydrogen chloride in water. Make sure to read the whole assignment first so that you can properly label the axes on your graph. Include a legend on your graph to distinguish one data set from the other. Part A: Solubility of potassium nitrate Read Lab Exercise 5.C on page 223. Next, on a sheet of graph paper construct a graph showing the relationship between the solubility of potassium nitrate and the temperature of the solution. Construct a best-fit line for the data. Part B: Solubility of hydrogen chloride Another experiment determined the solubility of hydrogen chloride in water by bubbling a known volume of hydrogen chloride through the water until it became saturated, then measuring the volume of hydrogen chloride remaining. This difference in volume was then used to calculate the mass of hydrogen chloride that was dissolved in the water. The experiment was repeated at various temperatures, while the pressure remained constant. Table 2: Solubility of hydrogen chloride at various temperatures. Temperature (oC) Volume of solution (mL) Mass of HCl(g) (grams) 10.0 100.0 75.1 20.0 100.0 70.0 30.0 100.0 65.5 40.0 100.0 61.0 50.0 100.0 57.5 On the same sheet of graph paper as you used in Part A, construct a graph showing the relationship between the solubility of hydrogen chloride and the temperature of the solution. Construct a best-fit line for the data. Part C: Analysis and Evaluation Answer the following questions on a separate sheet of paper. 1) Using the line of best fit on your potassium nitrate graph, predict the solubility at the following temperatures: a) 19oC b) 70oC 2) Using the line of best fit on your hydrogen chloride graph, predict the solubility at the following temperatures: a) 27oC b) 1oC c) 85oC 3) Could we use the line of best fit to predict the solubility of a compound at any given temperature? Why or why not? 4) Did the solubility and temperature relationships agree with what was predicted by our generalizations? 5) The design of Lab Exercise 5.C (pg 233) describes the process used to find the solubility of potassium nitrate. Could we use this method to determine the solubility of any solid compound? When you are finished, hand in this sheet along with your graph and the answers to the above questions Assignment: Investigating the Relationship between Solubility and Temperature Graph sheet Axes labelled correctly (w/units) Legend Accuracy of plotting Best fit line Legibility /4 /2 /2 /1 /1 Analysis and Evaluation Questions /10 Total /20
