Qiao et al. Online Resources: page Online Resources: Altered
advertisement
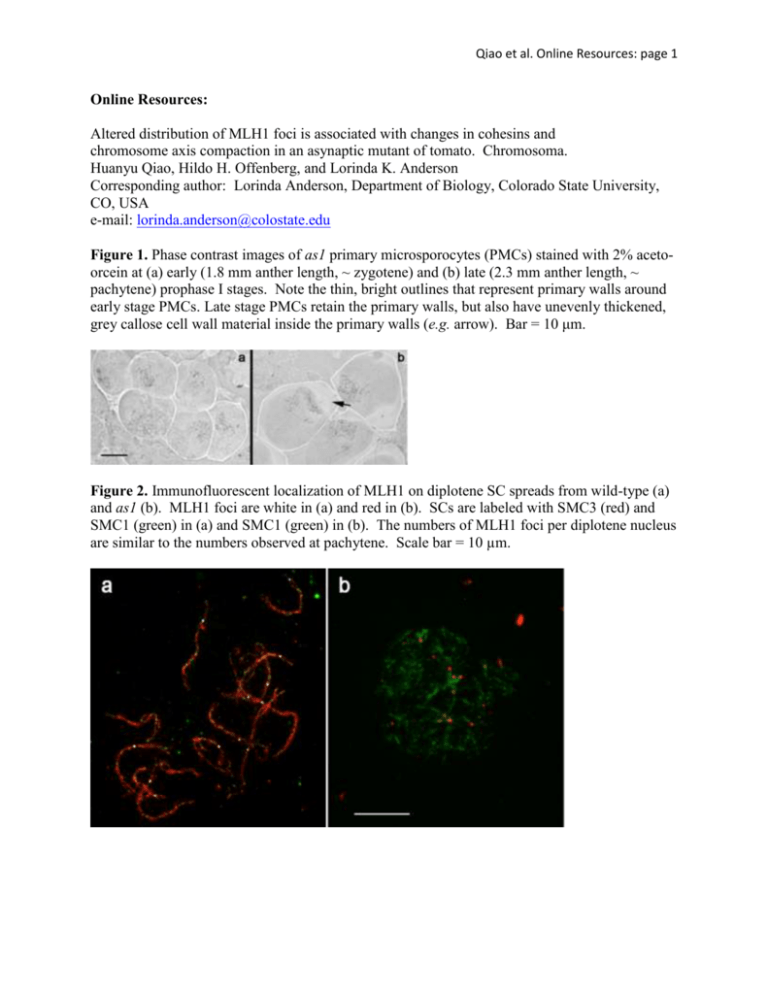
Qiao et al. Online Resources: page 1 Online Resources: Altered distribution of MLH1 foci is associated with changes in cohesins and chromosome axis compaction in an asynaptic mutant of tomato. Chromosoma. Huanyu Qiao, Hildo H. Offenberg, and Lorinda K. Anderson Corresponding author: Lorinda Anderson, Department of Biology, Colorado State University, CO, USA e-mail: lorinda.anderson@colostate.edu Figure 1. Phase contrast images of as1 primary microsporocytes (PMCs) stained with 2% acetoorcein at (a) early (1.8 mm anther length, ~ zygotene) and (b) late (2.3 mm anther length, ~ pachytene) prophase I stages. Note the thin, bright outlines that represent primary walls around early stage PMCs. Late stage PMCs retain the primary walls, but also have unevenly thickened, grey callose cell wall material inside the primary walls (e.g. arrow). Bar = 10 μm. Figure 2. Immunofluorescent localization of MLH1 on diplotene SC spreads from wild-type (a) and as1 (b). MLH1 foci are white in (a) and red in (b). SCs are labeled with SMC3 (red) and SMC1 (green) in (a) and SMC1 (green) in (b). The numbers of MLH1 foci per diplotene nucleus are similar to the numbers observed at pachytene. Scale bar = 10 µm. Qiao et al. Online Resources: page 2 Figure 3. Distribution of distances between MLH1 foci for as1 SC segments that have only two foci (n = 11). The average (mean) distance between the two foci is 40% (SD = 18%) or 5.0 µm (SD = 4.5 µm) of SC segment length. The expected average distance between two foci on the same SC segment in the absence of interference and assuming that the entire length of the fragment is equally likely to have an MLH1 focus is 33% with a higher proportion of shorter than longer distances separating the two foci. Based on these expectations, two MLH1 foci on the same SC segment in as1 still show interference. However, the sample size is quite small. Figure 4. Immunofluorescent localization of MLH1 (green) and SMC1 (red) on sucrose-spread SCs from wild-type (a) and as1 (b). The labeling pattern is similar to SC spreads made using the hypotonic spreading procedure (as in Text Figure 3). Scale bar = 10 µm. Qiao et al. Online Resources: page 3 Figure 5. Electron micrographs of MLH1-labeled RNs from (a) wild-type and (b) as1 showing the often larger size of RNs and slightly narrower SC structure from as1. Scale bar = 100 nm. Qiao et al. Online Resources: page 4 Figure 6. Immunofluorescent co-localization of (a, d) MRE11, (g, j) RAD50 or (m,p) RAD51 with (B,E, H, K, N, Q) SMC1 on wild-type SC spreads at leptotene-early zygotene (a-c; g-i, m-n) and as1 SC spreads at early stage (d-f, j-l, p-q). In the merged images (c, f, i, l, o, r), MRE11, RAD50 and RAD51 are in green and SMC1 is in red. There is no obvious difference in MRE11, RAD50, or RAD51 focal patterns in as1 compared to wild -type. The difference in MRE11 and RAD50 immunolabeling patterns has also been noted for Coprinus cinereus (Many et al. 2009 Chromosoma 118: 471-486). The specificity of the RAD50 antibody is shown in Supp. Fig. 7b. Scale bar = 10 μm. Qiao et al. Online Resources: page 5 Figure 7. Colocalization of (a) SMC3 and (b, c) SMC1 on a late stage as1 SC spread. Images in (a) and (b) were captured with the same settings and exposure time. The image in (b) was enhanced additionally using Photoshop software (c). The discontinuous SMC1 signal is not caused by AE/LE fragmentation, as shown by the continuous SMC3 signal. Scale bar = 10 μm. Figure 8. Late stage SC spread from as1 immunolabeled with SMC1 (a, inverted fluorescent image) then stained with silver and photographed using bright field microscopy (b). The discontinuities of the SMC1 signal along both AE and SC segments are not caused by AE/LE breakdown as demonstrated by the continuous silver staining of AEs and SCs. Scale bar = 5 μm. Qiao et al. Online Resources: page 6 Figure 9. Western blots of total anther proteins from tomato labeled with antibodies to (a) SMC3, (b) SMC3 and SMC1, or (c) RAD50. The protein concentration of each anther extract was determined using a quantitative assay (Minamide and Bamburg 1990), and each lane was loaded with 20 µg of total anther protein. (a) SMC3 protein is detectable as a major band at the expected electrophoretic mobility for tomato SMC3 protein (~150 kd) in pachytene stage anthers (lanes 1 – wild-type and 3 – as1), but not in pre-meiotic (lane 2 – as1) or post-meiotic (lane 4 – as1) stage anthers, indicating that most of the SMC3 signal comes from meiotic cells. Although the same antibodies were used for blots (a) and (b), the background for blot a is higher than for blot b, perhaps due to a longer primary antibody incubation time. (b) Pachytene stage anthers from wild-type (lanes 1 and 3) and late-stage anthers from as1 (lanes 2 and 4) labeled with antibodies to SMC3 (lanes 1 and 2) or SMC1 (lanes 3 and 4). Both SMC1 and SMC3 appear to be expressed in roughly similar amounts in as1 and in wild-type. These results suggest that a great reduction of SMC1 protein is not the primary reason for the reduced cytological staining of this protein in the mutant. (c) Characterization of the RAD50 antibody using a Western blot of anther proteins (20 µg total protein) from wild-type tomato. Antibodies to tomato RAD50 recognize a major band near the expected electrophoretic mobility. Anther proteins were extracted by macerating 20-25 anthers in 30 µl of a solution of 10 mM Tris, 5% B-mercaptoethanol, 0.01 mg/mL Leupeptin, 0.01 mg/mL Pepstatin A, 0.1 mM PMSF, 0.1 mM EDTA in a glass Duall homogenizer. The macerated mixture was transferred to a microtube. The homogenizer was rinsed with two 20 µl aliquots of 2x SDS-PAGE loading buffer (0.125 M Tris-HCl, pH 6.8, 4% SDS, 10% β-mercaptoethanol, 20% glycerol, 0.01% bromophenol blue), and the rinses were added to the microtube. The mixture was heated for 5 min in a boiling water bath and centrifuged for 20 min. at 14,000 rpm in a microcentrifuge. The protein concentration of the supernatant was determined using a quantitative spectrophotometric assay (Minamide and Bamburg 1990). Reference: Minamide LS, Bamburg JR (1990) A filter paper dye-binding assay for quantitative determination of protein without interference from reducing agents or detergents. Anal Biochem 190:66-70. Qiao et al. Online Resources: page 7 Figure 10. Late stage SC spreads from the asb mutant labeled with antibodies against (a) SMC3, (b) SMC1, and (c) REC8. The SMC1 and REC8 images are from the same nucleus and have been merged in (d). These results show that cohesin immunolabeling in asb is similar to that observed for wild-type tomato. Bar = 10 µm.
