nph4352-sup-0001-TableS1
advertisement
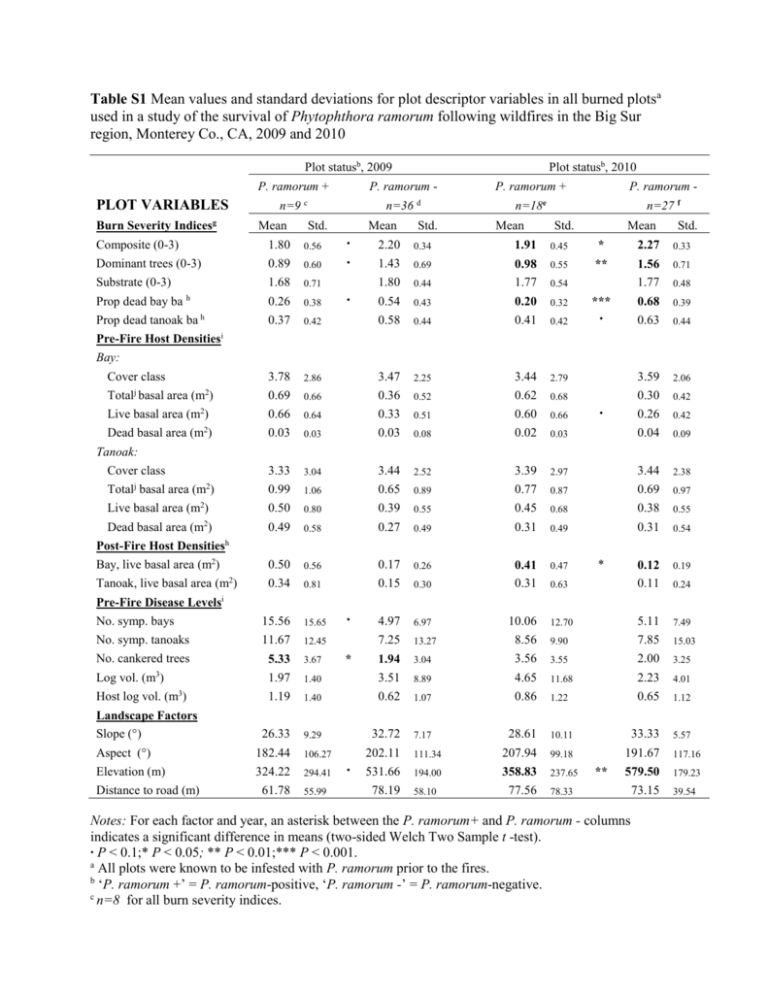
Table S1 Mean values and standard deviations for plot descriptor variables in all burned plotsa used in a study of the survival of Phytophthora ramorum following wildfires in the Big Sur region, Monterey Co., CA, 2009 and 2010 Plot statusb, 2009 P. ramorum + PLOT VARIABLES n=9 Burn Severity Indicesg Mean n=36 Std. 1.80 0.56 Dominant trees (0-3) 0.89 0.60 Substrate (0-3) 1.68 0.71 Prop dead bay ba h 0.26 0.38 0.37 Prop dead tanoak ba h Pre-Fire Host Densities P. ramorum - c Composite (0-3) Plot statusb, 2010 Mean ∙ ∙ d Std. P. ramorum + n=18 Mean P. ramorum - e n=27 f Std. Mean Std. 2.20 0.34 1.91 0.45 * 2.27 0.33 1.43 0.69 0.55 ** 0.44 1.56 1.77 0.71 1.80 0.98 1.77 0.54 0.43 0.32 *** 0.58 0.44 0.42 ∙ 0.68 0.63 0.39 0.42 0.20 0.41 ∙ 0.54 0.48 0.44 i Bay: Cover class 3.78 2.86 3.47 2.25 3.44 2.79 3.59 2.06 2 0.69 0.66 0.36 0.52 0.62 0.68 0.30 0.42 Live basal area (m ) 0.66 0.64 0.33 0.51 0.60 0.66 0.26 0.42 2 0.03 0.03 0.03 0.08 0.02 0.03 0.04 0.09 j Total basal area (m ) 2 Dead basal area (m ) ∙ Tanoak: Cover class 3.33 3.04 3.44 2.52 3.39 2.97 3.44 2.38 2 0.99 1.06 0.65 0.89 0.77 0.87 0.69 0.97 Live basal area (m ) 0.50 0.80 0.39 0.55 0.45 0.68 0.38 0.55 Dead basal area (m2) 0.49 0.58 0.27 0.49 0.31 0.49 0.31 0.54 0.50 0.56 0.17 0.26 0.47 0.81 0.15 0.30 0.63 0.12 0.11 0.19 0.34 0.41 0.31 4.97 6.97 10.06 12.70 5.11 7.49 7.25 13.27 8.56 9.90 7.85 15.03 j Total basal area (m ) 2 Post-Fire Host Densities h Bay, live basal area (m2) 2 Tanoak, live basal area (m ) * 0.24 Pre-Fire Disease Levelsi ∙ No. symp. bays 15.56 15.65 No. symp. tanoaks 11.67 12.45 No. cankered trees 5.33 1.97 3.67 1.94 3.51 3.04 3.56 3.55 2.00 3.25 1.40 8.89 4.65 11.68 2.23 4.01 1.19 1.40 0.62 1.07 0.86 1.22 0.65 1.12 26.33 9.29 32.72 7.17 5.57 Log vol. (m3) 3 Host log vol. (m ) Landscape Factors Slope (°) Aspect (°) 182.44 106.27 Elevation (m) 324.22 294.41 Distance to road (m) 61.78 55.99 * ∙ 28.61 10.11 33.33 202.11 111.34 207.94 99.18 191.67 117.16 531.66 194.00 358.83 77.56 237.65 579.50 73.15 179.23 78.19 58.10 78.33 ** Notes: For each factor and year, an asterisk between the P. ramorum+ and P. ramorum - columns indicates a significant difference in means (two-sided Welch Two Sample t -test). ∙ P < 0.1;* P < 0.05; ** P < 0.01;*** P < 0.001. a All plots were known to be infested with P. ramorum prior to the fires. b ‘P. ramorum +’ = P. ramorum-positive, ‘P. ramorum -’ = P. ramorum-negative. c n=8 for all burn severity indices. 39.54 d n=29 for all burn severity indices. n=16 for all burn severity indices. f n=21 for all burn severity indices. g Burn severity indices are continuous values from 0 (least severe) to 3 (most severe). h Proportion of basal area that died between 2006 and 2009 i All unit measurements (m2,No., m3) are given per plot (1/20 ha). j Total basal area is the sum of live and dead basal areas. e
