Answers
advertisement
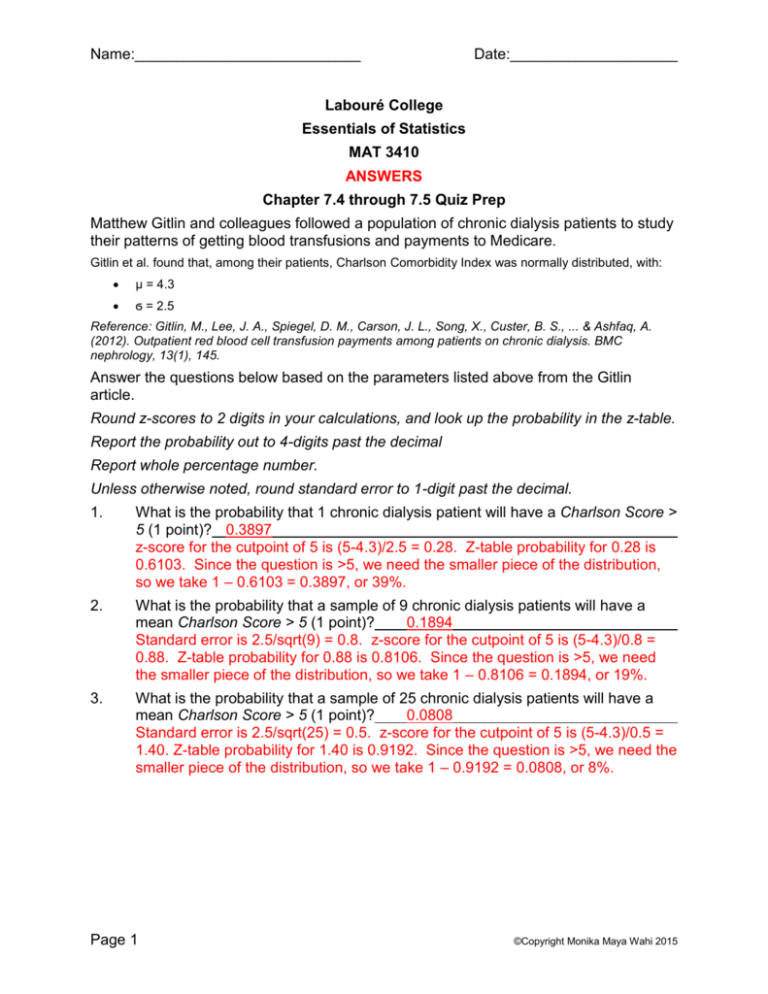
Name:___________________________ Date:____________________ Labouré College Essentials of Statistics MAT 3410 ANSWERS Chapter 7.4 through 7.5 Quiz Prep Matthew Gitlin and colleagues followed a population of chronic dialysis patients to study their patterns of getting blood transfusions and payments to Medicare. Gitlin et al. found that, among their patients, Charlson Comorbidity Index was normally distributed, with: μ = 4.3 ϭ = 2.5 Reference: Gitlin, M., Lee, J. A., Spiegel, D. M., Carson, J. L., Song, X., Custer, B. S., ... & Ashfaq, A. (2012). Outpatient red blood cell transfusion payments among patients on chronic dialysis. BMC nephrology, 13(1), 145. Answer the questions below based on the parameters listed above from the Gitlin article. Round z-scores to 2 digits in your calculations, and look up the probability in the z-table. Report the probability out to 4-digits past the decimal Report whole percentage number. Unless otherwise noted, round standard error to 1-digit past the decimal. 1. What is the probability that 1 chronic dialysis patient will have a Charlson Score > 5 (1 point)? 0.3897 z-score for the cutpoint of 5 is (5-4.3)/2.5 = 0.28. Z-table probability for 0.28 is 0.6103. Since the question is >5, we need the smaller piece of the distribution, so we take 1 – 0.6103 = 0.3897, or 39%. 2. What is the probability that a sample of 9 chronic dialysis patients will have a mean Charlson Score > 5 (1 point)? 0.1894 Standard error is 2.5/sqrt(9) = 0.8. z-score for the cutpoint of 5 is (5-4.3)/0.8 = 0.88. Z-table probability for 0.88 is 0.8106. Since the question is >5, we need the smaller piece of the distribution, so we take 1 – 0.8106 = 0.1894, or 19%. 3. What is the probability that a sample of 25 chronic dialysis patients will have a mean Charlson Score > 5 (1 point)? 0.0808 Standard error is 2.5/sqrt(25) = 0.5. z-score for the cutpoint of 5 is (5-4.3)/0.5 = 1.40. Z-table probability for 1.40 is 0.9192. Since the question is >5, we need the smaller piece of the distribution, so we take 1 – 0.9192 = 0.0808, or 8%. Page 1 ©Copyright Monika Maya Wahi 2015 Name:___________________________ Date:____________________ 4. What is the probability that 1 chronic dialysis patient will have a Charlson Score between 4 and 5? (2 points)? 0.1581 As noted in question 1, the probability for the z-score for the cutpoint of 5 is 0.6103 (this piece represents the probability of getting 5 or lower). The z-score for a Charlson of 4 is (4-4.3)/2.5 = -0.12. The probability in the Z-table corresponding to 4 is 0.4522 (this probability represents the probability of getting 4 or lower). The probability for 5 or greater minus the probability for 4 or greater is 0.6103 – 0.4522 = 0.1581 = 16%. 5. What is the probability that a sample of 9 chronic dialysis patients will have a mean Charlson Score between 4 and 5? (2 points)? 0.4512 As noted in question 2, the probability of a z-score for the cutpoint of 5 in a sample of 9 is 0.8106 (this represents the probability of getting 5 or lower). The z-score for Charlson of 4 (in a sample of 9) is (4-4.3)/(2.5/sqrt(9)) = -0.36. The probability in the z-table corresponding to 4 is 0.3594 (this is the probability of getting 4 or lower). 0.8106 – 0.3594 = 0.4512 or 45%. 6. What is the probability that a sample of 25 chronic dialysis patients will have a mean Charlson Score between 4 and 5? (2 points)? 0.6449 As noted in question 3, the probability of a z-score for the cutpoint of 5 in a sample of 25 is 0.9192 (this represents the probability of getting 5 or lower). The z-score for Charlson of 4 (in a sample of 25) is (4-4.3)/(2.5/sqrt(25)) = -0.60. The probability in the z-table corresponding to 4 is 0.2743 (this is the probability of getting 4 or lower). 0.9192 – 0.2743 = 0.6449 or 64%. 7. Why is it that the probability of getting a sample with a sample mean near the population mean always increases as you sample more individuals? a. b. c. d. The bigger the standard deviation, the smaller the n. The bigger the n, the smaller the standard error. The bigger the mean, the smaller the variance. The bigger the variance, the smaller the standard deviation. The standard error is on the bottom of the equation. The standard error is the standard deviation divided by the square root of n. By making n big, we make the standard error smaller, because the bottom of the equation gets bigger. Page 2 ©Copyright Monika Maya Wahi 2015
