Principles of beam intensity
TEP
5.5.03
-00
Related topics
Beam Intensity in relation to power and kV, inverse square law, beam hardening, filtration, spectrum,
polychromaticity, detector dark current
Principle
Laboratory based X-ray sources are in most cases polychromatic, meaning that the spectrum of the
source consists of an energy range instead of a single distinctive energy peak. This has a lot of influence
on the X-ray measurements that are performed. Especially the relation of the pixel count on the digital
detector versus the beam power is important for optimal image quality.
Equipment
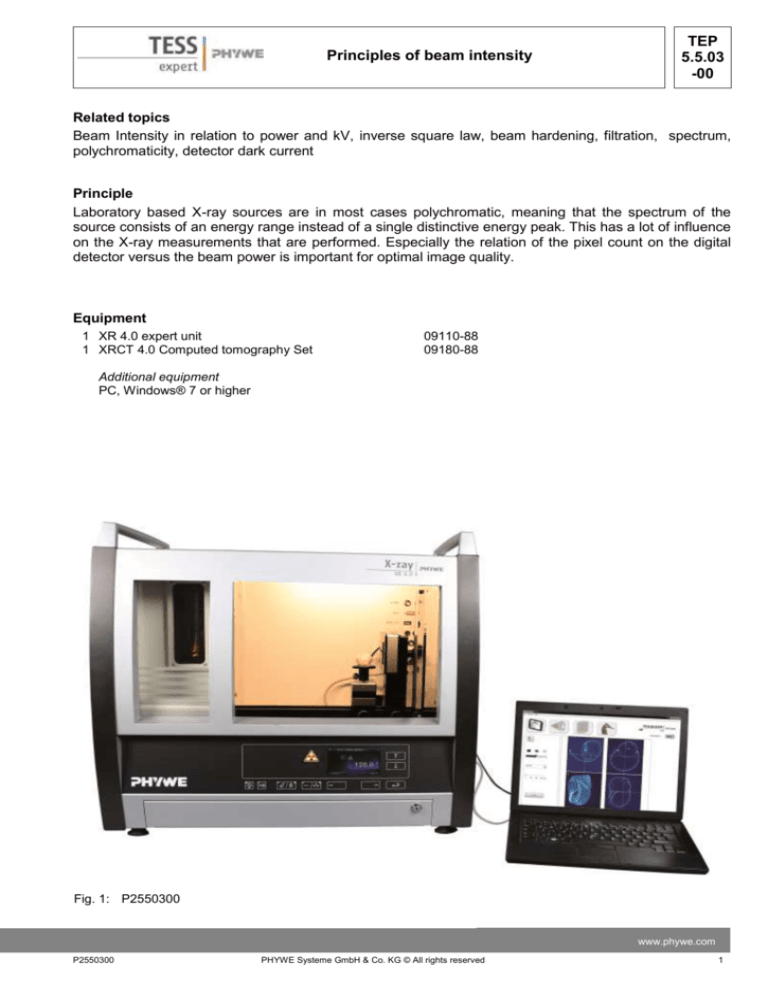
1 XR 4.0 expert unit
1 XRCT 4.0 Computed tomography Set
09110-88
09180-88
Additional equipment
PC, Windows® 7 or higher
Fig. 1: P2550300
www.phywe.com
P2550300
PHYWE Systeme GmbH & Co. KG © All rights reserved
1
TEP
5.5.03
-00
Principles of beam intensity
Tasks
1. Determine the variation in beam intensity
2. Investigate the inverse square law.
Set-up
Attach the XRIS to its stage.
Place the Digital X-ray detector XRIS on the rail at position 25 cm. The back side of the XRIS stage corresponds to its position on the rail. This position is called the 'source to detector distance' SDD (mm).
Note
Fig. 2: Set-up of the XRIS
Details concerning the operation of the X-ray unit and Detector as well as information on how to handle
the detector can be found in the respective operating instructions.
2
PHYWE Systeme GmbH & Co. KG © All rights reserved
P2550300
TEP
5.5.03
-00
Principles of beam intensity
Procedure
- Connect the X-ray unit via USB cable to the
USB port of your computer (the correct port of
the X-ray unit is marked in Fig. 3).
- Connect the usb cable of the detector to the
computer
-
-
-
-
-
-
Start the “measureCT” program. A virtual X-ray
unit , rotation stage and Detector will be displayed on the screen. The green indication LED
on the left of each components indicates that its
presence has been detected (Fig. 4)
You can change the High Voltage and current
of the X-ray tube in the corresponding input
windows or manually on the unit. (Fig.4)
When clicking on the unit pictogram additional
information concerning the unit can be retrieved( Fig.4)
The status pictogram indicate the status of the
unit and can also be used to control the unit
such as switching on and off the light or the Xrays (Fig4.)
The position of the digital detector can be adjusted to its real position either by moving the
XRIS pictogram or by filling in the correct value
in the input window. (Fig.4)
Fig. 3: Connection of the computer
The settings of the XRIS can be adjusted using
the input windows. The exposure time controls
the time between two frames are retrieved from
the detector, the number of frames defines how
many frames are averaged and with the binning
mode the charge of neighbouring pixels is averaged to reduce the total amount of pixels in one
frame.
Fig. 4: Part of the user interface of the software
www.phywe.com
P2550300
PHYWE Systeme GmbH & Co. KG © All rights reserved
3
TEP
5.5.03
-00
Principles of beam intensity
Experiment execution
1. Determine the variation in beam intensity
-
Adjust the XRIS settings and X-ray unit settings according to fig 5 or load the configuration from the
predefined CTO file 'Experiment 3' (see Fig 5).
Overview of the settings of the XRIS and Xray unit:
- 35kV, 1.00mA
- exposure time 0.5 sec
- Number of frames: 1
- Binning mode 500x500
- SDD= 250
Fig. 5: The settings for this experiment (left panel) and the method load and adjust the settings (right panel)
-
Start a new experiment, give it a unique name and fill in your details (fig.6). Alternatively it is also
possible to load this experiment with pre-recorded images and open this manual. The correct configuration will be loaded automatically as well but the functionalities of the software will be limited to
avoid overwriting the existing data.
Fig. 6: How to create a new or open an existing experiment
4
PHYWE Systeme GmbH & Co. KG © All rights reserved
P2550300
Principles of beam intensity
-
-
-
-
-
-
TEP
5.5.03
-00
Check whether the detector is not saturated for the highest power (35kV, 1mA) (see experiment 1)
Switch of the X-ray source and wait a couple of seconds. Activate the 'live view'. Wait long enough
between the image to allow the source and detector to adjust to the new settings (3-5 sec.). Deactivate the 'live view'.
Take on image with the X-rays of and save it as DI_500ms in the tiff format.
Switch on the X-rays
Take un-calibrated images at 35kV but change the current in steps of 0.1 from 0 to 1mA, save the
images accordingly. Wait long enough between the image to allow the source and detector to adjust
to the new settings.
Take un-calibrated images for 20kV but change the current in steps of 0.1 from 0 to 1mA, save the
images accordingly.
Open the viewer
Double click on the DI_500ms image, 'Set as offset image' (see fig 7.1) and normalise (see fig7.2).
This way the detector dark current is subtracted from the images.
Double click on one of the other images. Select a large, central region of image 'see fig.7.3), calculate the average pixel count (average grey value), (see fig.7.4 and 7.5) in that region and write it
down.
Repeat this for all the images that were saved.
Fig. 7: How to normalise for dark current and calculate the pixel count
-
Put the results in a table and calculate the power for every setting (see fig 8)
www.phywe.com
P2550300
PHYWE Systeme GmbH & Co. KG © All rights reserved
5
TEP
5.5.03
-00
Principles of beam intensity
Fig. 8: Pixels counts in function of current and power for different kV settings
-
Make a plot of the resulting pixel counts in
function of the current (see fig.9)
Note: For the same current settings but different
kV settings, the pixel count is much lower. There
are two several reasons for this, the first reason
that the beam intensity is correlated to the beam
power and not to the current alone.
Make a plot of the resulting pixel
counts in function of the power (see
fig.10)
Fig. 9: Pixels counts in function of current for different kV settings
Note: Even when the beam power is correlated to
the pixel count, the pixel count at lower kV is much
lower. This is caused by the inherent filtration of the
X-ray source and the sensitivity of the detector (see
theory for more info).
Fig. 10: Pixels counts in function of the power for different kV
settings
2. Investigate the inverse square law
6
Move the detector to position SDD= 200
Take and save an image
Repeat this for SDD= 250,300,350,400
Open the image viewer, correct for dark current and calculate the average pixel count in a
relatively large area (see fig 7)
Make a table and plot the results (see fig 11)
PHYWE Systeme GmbH & Co. KG © All rights reserved
P2550300
Principles of beam intensity
TEP
5.5.03
-00
Fig. 11: Pixels counts in function of the SDD for same power and kV settings.
Note: The pixel count for SDD= 200 is approximately four times higher than at position SDD=400. This
effect is called the inverse square law. (see theory for more info)
Theory
Detector saturation
With digital X-ray imaging, X-ray photons that interact with the detector are converted to a digital signal.
Such a digital detector is composed of a raster of pixels (picture elements) and each pixel can be considered as bucket. For each interaction of an X-ray photon with the detector, a series of electrons are
produced in the pixel corresponding with the location of the photon interaction. These electrons are
stored in the pixel, gradually filling up the bucket. After a set time interval, "exposure time", the electron
content of the pixel is measured by emptying it. For the same intensity of X-ray's, a longer exposure time
will results in a larger number of pixels in the bucket.
Each digital detector has a limited bucket size which is called the 'full well capacity' of the detector.
When this level off fill is reached, additional electrons are thrown away because the detector is saturated. A saturated detector will cause inconsistent measurements and has thus to be avoided.
Detector calibration
Each digital detector has a different and variable offset and pixel-specific output. During the calibration
these variations will be measured and used in the subsequent imaging.
Even without the X-rays on, the detector will generate a read-out value that is different from 0, called
'dark image'. This has several reasons from which the main reasons are an electronic offset and readout noise. When determining the beam intensity I0, it is important to subtract this offset (ID) from the
measured read-out (I0,M).
𝐼0 = 𝐼0,𝑀 − 𝐼𝐷
Another issue that exists, is that the sensitivity of every detector pixel is slightly different, resulting in a
wide variation of I0 values for every pixel. During calibration, these variations are recorded.
After calibration, the Transmission value for every pixel (I) is recalculated based on the beam intensity of
that pixel at that time (IM), the beam intensity during calibration(I0,M) and the dark current intensity (ID)
during calibration.
www.phywe.com
P2550300
PHYWE Systeme GmbH & Co. KG © All rights reserved
7
TEP
5.5.03
-00
Principles of beam intensity
𝑇=
𝐼𝑀 − 𝐼𝐷
𝐼0,𝑀 − 𝐼𝐷
If the calibration was successfully performed, after calibration the images have grey-values between 0
and 1.
Generation of X-rays and polychromaticity
In an X-ray source, electrons are accelerated over a certain voltage before hitting the target material
where X-rays are formed. The electrons are generated through thermionic emission from a heated filament at the cathode side. The emitted electrons are accelerated towards the target, at the anode side,
by a high voltage applied between the cathode and the anode. The amplitude of the acceleration voltage
corresponds to the kV settings (between 0 and 35kV) applied on the source and the current value corresponds to the amount of electrons that reach the target.
When the electrons, that all have the same acceleration (keV), bombard the target a series of events occur when the electrons lose their energy due to impact. In most cases (99%), the kinetic energy of the
electrons will be converted to heat but in some cases they also generate characteristic and Bremsstrahlung X-ray photons. These photons are used for the imaging process.
The Bremsstralung or braking radiation is generated when an electron is decelerated. During deceleration, the kinetic energy that the electron loses is transferred to an X-ray photon. The electron can lose a
part of its energy or all of its energy. Because of this variation, the resulting photons will have a variety of
energies, but all smaller than the maximal kinetic energy of the incident electron (keV). The spectrum of
the X-ray photons leaving the source will thus be relatively broad with a maximum corresponding to the
acceleration voltage, for this reason the spectrum is called polychromatic in adverse to monochromatic,
where all the photons have a single energy.
In addition to the continuous bremsstralung spectrum, the interaction of an incident electron with the atoms of the target material can cause the generation of characteristic X-ray photon, which have a certain
energy.
The spectrum that comes out of an X-ray source is a combination of the bremsstralung and the characteristic X-ray photons.
Source power in function of kV and current
The intensity of the X-ray photon beam is determined by various parameters but in general we can say
that the beam intensity is proportional to the target power (P). The target power corresponds to the total
energy of the electron beam hitting the target, i.e. the combination of acceleration voltage (U) and current (I).
𝐼0 ~ 𝑃𝑡𝑎𝑟𝑔𝑒𝑡 (𝑊𝑎𝑡𝑡)
𝑃𝑡𝑎𝑟𝑔𝑒𝑡 (𝑊𝑎𝑡𝑡) = 𝑈(𝑘𝑉) ∗ 𝐼 (𝑚𝐴)
The target power for source settings of 20kV and 0.3 mA is the same as for 30kV and 0.2mA.
In reality, the detected beam intensity is not identical for both settings due to several reasons. one of the
main causes is the polychromatcity of the beam. As the X-ray source consists of a vacuum chamber with
glass tube, the tube itself will cause important filtration, mainly for the lower energy X-ray photons. As the
8
PHYWE Systeme GmbH & Co. KG © All rights reserved
P2550300
TEP
5.5.03
-00
Principles of beam intensity
average photon energy of the 20kV spectrum is lower than the 30 kV spectrum, a larger part of the photons will be stopped by the tube, and thus have a lower intensity. This also causes the beam to have a
higher average energy than before it was filtered, this is called hardening the beam.
Additionally, the energy dependant sensitivity of the detector and other effects will add up to that effect.
0
35kV,
original
20kV,
original
zonder
35kV,
with tube
20kV,
with tube
20
0
20
Beam intensity, inverse square law
The intensity of the beam, as measured by the detector, is defined by the amount and energy of the Xray photons hitting each pixel. If a pixel, that is positioned at a certain position (ex. SDD1= 200mm)
measures and intensity I1, the intensity I2 in the same pixel will be four times lower if its distance to the
source is doubled ( ex. SDD2= 400mm). The reason for this is that the beam intensity is proportional to
the surface it is projected on. The size of the beam that hits the pixel at the first position has the ability to
illuminate four pixels of the same size at the second position. This is called the 'inverse square law' as
the decrease in intensity is the square of the increase in distance from the source.
𝐼2 =
𝐼1
𝑆𝐷𝐷 2
(𝑆𝐷𝐷2 )
1
www.phywe.com
P2550300
PHYWE Systeme GmbH & Co. KG © All rights reserved
9
TEP
5.5.03
-00
Principles of beam intensity
Transmission and Attenuation
In X-ray imaging, the transmission or attenuation of X-rays through a certain object are measured. Depending on the settings of the source, a beam with a certain intensity I0 is measured by the detector
when no object is placed between the source and the detector. When an object is placed in the path of
the beam, this object will attenuate the beam so that the detector measures a smaller intensity I instead
of I0. The remaining intensity I compared to the original I0 is called transmission (T), which is the opposite
of the attenuation (A) of the object.
For a calibrated detector, the beam intensity is rescaled to a value between 1 and 0. With T= 1 for the
beam without an object in front of the detector (I0).
𝑇𝑜𝑏𝑗 =
𝐴𝑜𝑏𝑗 =
𝐼
= 1 − 𝐴𝑜𝑏𝑗
𝐼0
𝐼0 − 𝐼
= 1 − 𝑇𝑜𝑏𝑗
𝐼0
Influence of kV and material
The transmission of a certain object (Tobj) is determined by its chemical composition, its density and its
thickness as described by the Lambert-Beer law:
𝑇𝑜𝑏𝑗 =
10
𝐼
= 𝑒 −µ𝑥
𝐼0
PHYWE Systeme GmbH & Co. KG © All rights reserved
P2550300
Principles of beam intensity
TEP
5.5.03
-00
with µ the linear attenuation (cm-1) coefficient and x the thickness(cm). The linear attenuation coefficient
is different for every material but also varies in function of the X-ray photon energy. For the same material but varying material thickness and two different photon energies E1 and E2, the transmission will decrease with increasing thickness and will increase for a higher energy. For example if E1 is higher than
E2 it could look like this:
Beam hardening and filtration
A polychromatic X-ray beam consists of X-ray photons with different energies. As the lower-energy photons are absorbed more rapidly, the beam becomes harder (higher mean energy) as it passes through
an object.
If the beam was monochromatic, the mean energy of the beam would not change will passing through
several slabs of the same material and same thickness, only the intensify would. The transmission (T) for
each of the three slabs separately would be identical.
𝐸1 = 𝐸2 = 𝐸3 = 𝐸4
𝐼1 > 𝐼2 > 𝐼3 > 𝐼4
𝑇1 =
𝐼2
𝐼3
𝐼4
= 𝑇2 = = 𝑇3 = = 𝑒 −µ𝑥
𝐼1
𝐼2
𝐼3
As the linear attenuation coefficient (µ) is energy dependant, but the mean energy remains the same, the
www.phywe.com
P2550300
PHYWE Systeme GmbH & Co. KG © All rights reserved
11
TEP
5.5.03
-00
Principles of beam intensity
total transmission (Ttot) through the three slabs equals the product of the three transmission:
𝐼4
𝐼1
𝐼4 𝐼3 𝐼2
= ∗ ∗
𝐼3 𝐼2 𝐼1
= 𝑇3 ∗ 𝑇2 ∗ 𝑇1
𝑇𝑡𝑜𝑡 =
𝑇1 ∗ 𝑇2 ∗ 𝑇3 = 𝑒 −µ𝑥 ∗ 𝑒 −µ𝑥 ∗ 𝑒 −µ𝑥
= 𝑒 −(µ𝑥+µ𝑥+µ𝑥)
= 𝑒 −µ(3𝑥)
When the beam is polychromatic, the mean energy of the beam will increase as it passes through the
different slabs:
𝐸1 < 𝐸2 < 𝐸3 < 𝐸4
𝐼1 > 𝐼2 > 𝐼3 > 𝐼4
𝐼2
= 𝑒 −µ1 𝑥
𝐼1
𝐼3
𝑇2 = = 𝑒 −µ2 𝑥
𝐼2
𝐼4
𝑇3 = = 𝑒 −µ3 𝑥
{
𝐼3
As the linear attenuation coefficient (µ) is energy dependant and mostly decreasing with increasing photon energy. The transmission for each of the separate slabs will decrease.
𝑇1 =
µ1 > µ2 > µ3
𝑇1 < 𝑇2 < 𝑇3
The total transmission (Ttot) through the three slabs equals the product of the three transmission:
𝐼4
𝐼1
𝐼4 𝐼3 𝐼2
= ∗ ∗
𝐼3 𝐼2 𝐼1
= 𝑇3 ∗ 𝑇2 ∗ 𝑇1
𝑇𝑡𝑜𝑡 =
𝑇1 ∗ 𝑇2 ∗ 𝑇3 = 𝑒 −µ1 𝑥 ∗ 𝑒 −µ2 𝑥 ∗ 𝑒 −µ3 𝑥
= 𝑒 −(µ1 𝑥+µ2 𝑥+µ3 𝑥)
12
PHYWE Systeme GmbH & Co. KG © All rights reserved
P2550300
Principles of beam intensity
TEP
5.5.03
-00
If µA is considered as the average linear attenuation coefficient over the three slabs, calculating the
thickness of one slab with µA would result in an overestimation of the thickness while for more than three
slabs it would result in an underestimation of the thickness.
𝑇𝑡𝑜𝑡
= 𝑒 −(µ1 𝑥+µ2 𝑥+µ3 𝑥)
= 𝑒 −3µ𝐴 𝑥
if:
𝑇1 =
𝐼2
= 𝑒 −µ𝐴 𝑥1
𝐼1
than:
𝑥1 > 𝑥
because
µ𝐴 < µ1
The beam hardening will not increase in a linear way but rather gradually decrease when the thickness is
augmented. In order to diminish the beam hardening effect in an imaging process it is therefore advised
to use some filtration. The filtration will cause the beam to harden prior to interacting with the sample. If,
the filtration is adopted before the calibration of the detector, the measured transmission will be more
correct for various thicknesses.
Note: Excessive filtration does not only causes the beam to harder but will also severely reduce the intensity of the beam. Choosing the correct filtration is a trade-off between beam hardening and beam intensity. Lower beam intensity will cause less good images.
www.phywe.com
P2550300
PHYWE Systeme GmbH & Co. KG © All rights reserved
13

