Lesson 16 ~ Introduction to Probability
advertisement
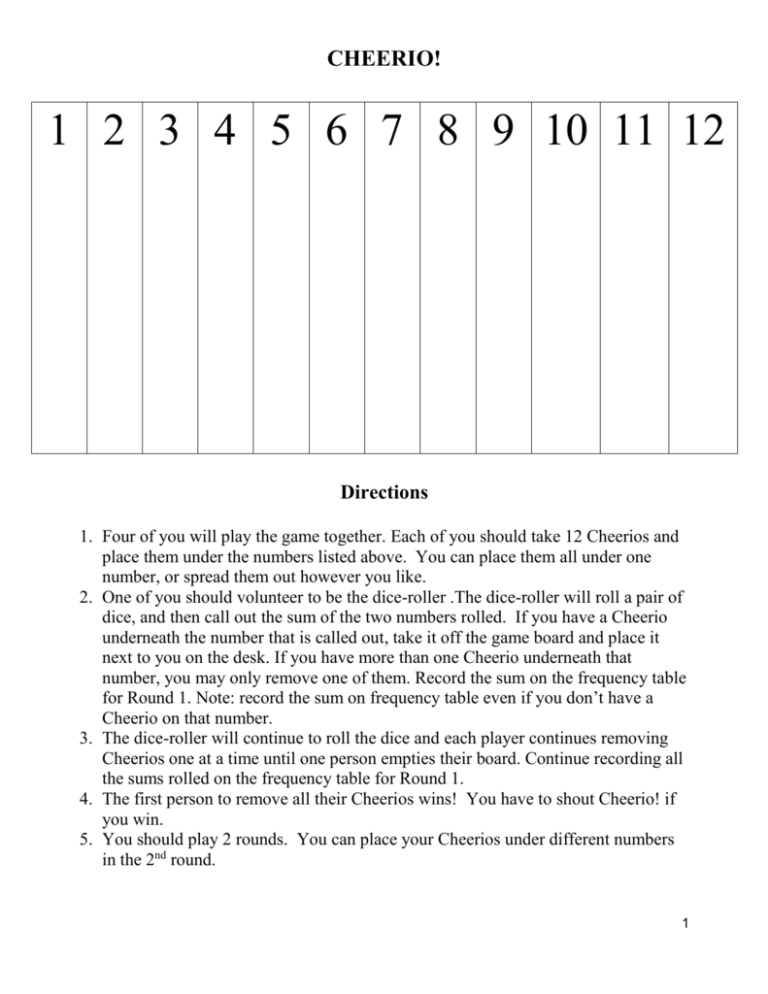
CHEERIO! 1 2 3 4 5 6 7 8 9 10 11 12 Directions 1. Four of you will play the game together. Each of you should take 12 Cheerios and place them under the numbers listed above. You can place them all under one number, or spread them out however you like. 2. One of you should volunteer to be the dice-roller .The dice-roller will roll a pair of dice, and then call out the sum of the two numbers rolled. If you have a Cheerio underneath the number that is called out, take it off the game board and place it next to you on the desk. If you have more than one Cheerio underneath that number, you may only remove one of them. Record the sum on the frequency table for Round 1. Note: record the sum on frequency table even if you don’t have a Cheerio on that number. 3. The dice-roller will continue to roll the dice and each player continues removing Cheerios one at a time until one person empties their board. Continue recording all the sums rolled on the frequency table for Round 1. 4. The first person to remove all their Cheerios wins! You have to shout Cheerio! if you win. 5. You should play 2 rounds. You can place your Cheerios under different numbers in the 2nd round. 1 Probability Worksheet for Cheerio Game Part I: Experimental Probability Record all of the sums rolled for each round with tally marks. Determine the total frequency of each sum from rounds 1 and 2. Then record the total number of rolls from rounds 1 and 2. Using this information, calculate the experimental probability of rolling each sum. The experimental probability is the ratio of the total frequency of each sum to the total number of rolls. Record this in your table. Sum Tally Marks Round 1 Frequency Round 1 Tally Marks Round 2 Frequency Round 2 Total Frequency (Round 1 + Round 2) Experimental Probability 1 2 3 4 5 6 7 8 9 10 11 12 Total # of Rolls N/A After Round 1, answer the following questions: 1. How did you decide where to place your Cheerios? 2. In round 2, will your place your Cheerios differently? Why/Why not? After Round 2, answer the following questions: 3. Did the changes in the distribution of the Cheerios change your outcome? 4. Examine the frequency table from round 1 and 2. Do you see a pattern? 5. According to the experimental probability, which sum has the greatest chance of occurring? 6. According to the experimental probability, which sum has the lowest chance of occurring? 2 Part II: Theoretical Probability Fill in the table. It shows the possible outcomes of one number cube across the top, and a second one down the left column. The corresponding sums are shown in the table. Find the sum of the number in the column + the number in the row: (A few boxes have been filled in for you as an example) 1 2 3 4 5 6 1 2 2 3 4 5 6 7 12 How many sums are shown in the chart? Find and record the frequency of each sum (the number of times it appears in the table above). Using this information, calculate the theoretical probability of rolling each sum. The theoretical probability is the ratio of favorable outcomes to the number of possible outcomes. Record this in your table. For example, to find the probability of rolling a 7, find the number of ways to get a sum of 7 = 6 = 1 . number of outcomes possible 36 6 Sum Frequency Theoretical Probability 1. Which sum(s) has the greatest theoretical probability of occurring? 1 2 2. Is your answer to 1 different from your answer to Part I #5? If so, why do you think this happened? 3 4 5 3. Which sum(s) has the lowest theoretical probability of occurring? 6 7 8 4. Is your answer to 3 different from your answer to Part I #6? If so, why do you think this happened? 9 10 11 5. Based on what you learned during this activity, what is the difference between theoretical probability and experimental probability? 12 Total # of Rolls N/A 3
