Histograms to verbal
advertisement
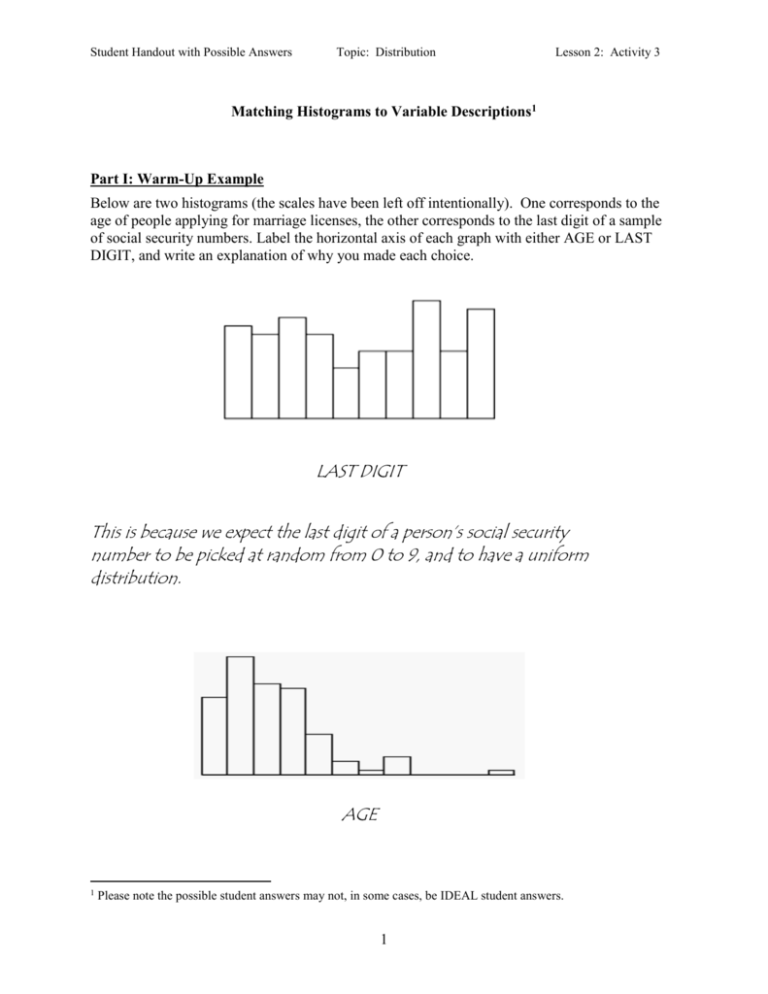
Student Handout with Possible Answers Topic: Distribution Lesson 2: Activity 3 Matching Histograms to Variable Descriptions1 Part I: Warm-Up Example Below are two histograms (the scales have been left off intentionally). One corresponds to the age of people applying for marriage licenses, the other corresponds to the last digit of a sample of social security numbers. Label the horizontal axis of each graph with either AGE or LAST DIGIT, and write an explanation of why you made each choice. LAST DIGIT This is because we expect the last digit of a person’s social security number to be picked at random from 0 to 9, and to have a uniform distribution. AGE 1 Please note the possible student answers may not, in some cases, be IDEAL student answers. 1 Student Handout with Possible Answers Topic: Distribution Lesson 2: Activity 3 We think that more people in their late teens and twenties apply to get married whereas there are not as many older people wanting to get married. Part II After completing the warm-up example, match each of the following variable descriptions with one of the histograms given below. Give your reason for each of your matches. You may find that your own knowledge may give you additional clues about the expected distribution of the variables. Discuss your answers and justifications with other students in your group. (a) The height of college students in a class. (4) We expect that the college students’ heights are normally distributed. (b) Number of siblings of college students in a class. (1 or 2) We expect that a typical family has 2 to 3 children. (c) Amount paid for last haircut by college students in a class. (1 or 2) Most students would not pay very much for their haircuts while some students may feel justified in treating themselves to expensive haircuts. (d) Students’ guesses of their professor’s age on the first day of class. (3) Most students would expect that their professor is older. 2 Student Handout with Possible Answers Topic: Distribution Lesson 2: Activity 3 (1) (2) (3) (4) References Rossman, A., Chance, B., & Lock, R. (2001). Workshop statistics: Discovery with data and Fathom. Emeryville, CA: Key College Publishing. Scheaffer, R.L., Watkins, A. Witmer, J., & Gnanadesikan, M., (2004a). Activity-based statistics: Instructor resources (2nd edition, Revised by Tim Erickson). Key College Publishing. 3


