Algebra II Name: Unit #3: Polynomial Functions Block: ______ 5.1
advertisement
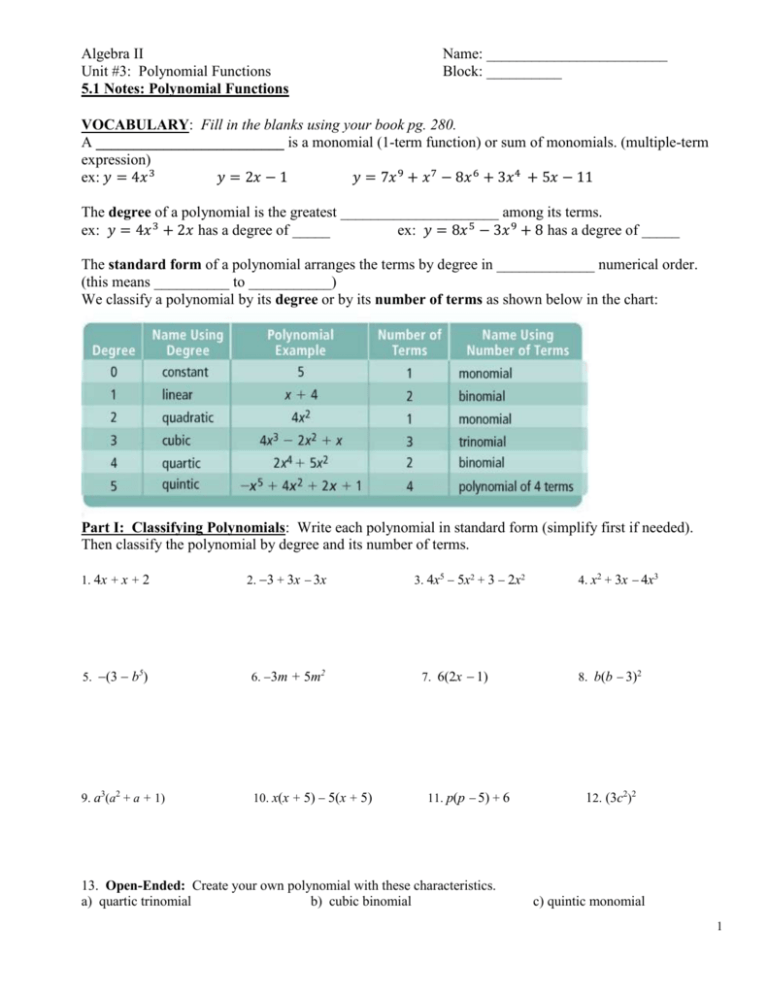
Algebra II Unit #3: Polynomial Functions 5.1 Notes: Polynomial Functions Name: ________________________ Block: __________ VOCABULARY: Fill in the blanks using your book pg. 280. A _________________________ is a monomial (1-term function) or sum of monomials. (multiple-term expression) ex: 𝑦 = 4𝑥 3 𝑦 = 2𝑥 − 1 𝑦 = 7𝑥 9 + 𝑥 7 − 8𝑥 6 + 3𝑥 4 + 5𝑥 − 11 The degree of a polynomial is the greatest _____________________ among its terms. ex: 𝑦 = 4𝑥 3 + 2𝑥 has a degree of _____ ex: 𝑦 = 8𝑥 5 − 3𝑥 9 + 8 has a degree of _____ The standard form of a polynomial arranges the terms by degree in _____________ numerical order. (this means __________ to ___________) We classify a polynomial by its degree or by its number of terms as shown below in the chart: Part I: Classifying Polynomials: Write each polynomial in standard form (simplify first if needed). Then classify the polynomial by degree and its number of terms. 1. 4x + x + 2 2. 3 + 3x 3x 5. (3 b5) 6. 3m + 5m2 9. a3(a2 + a + 1) 10. x(x + 5) 5(x + 5) 3. 4x5 5x2 + 3 2x2 7. 6(2x 1) 11. p(p 5) + 6 13. Open-Ended: Create your own polynomial with these characteristics. a) quartic trinomial b) cubic binomial 4. x2 + 3x 4x3 8. b(b 3)2 12. (3c2)2 c) quintic monomial 1 Part II: Graphing Calculator Exploration – Investigating Shapes and End Behavior VOCAB: End Behavior – the direction of the graph to the far left (as x approaches negative infinity) and far right (as x approaches positive infinity) For each function, sketch a graph and identify the left and right end behavior of the function (up or down). **Use one color for ALL POSITIVE graphs, use a different color for ALL NEGATIVE graphs.** a) 𝑦 = 𝑥1 𝑦 = −𝑥1 b) 𝑦 = 𝑥 2 𝑦 = −𝑥 2 (+) L: _____ R: _____ (-) L: _____ R: _____ (+) L: ____ R: ____ (-) L: _____ R: ____ e) 𝑦 = 𝑥 5 𝑦 = −𝑥 5 f) 𝑦 = 𝑥 6 𝑦 = −𝑥 6 (+) L: _____ R: _____ (-) L: _____ R: _____ (+) L: ____ R: ____ (-) L: _____ R: ____ c) 𝑦 = 𝑥 3 𝑦 = −𝑥 3 (+) L: ____ R: ____ (-) L: ____ R: _____ g) 𝑦 = 𝑥 7 𝑦 = −𝑥 7 (+) L: ____ R: ____ (-) L: ____ R: _____ d) 𝑦 = 𝑥 4 𝑦 = −𝑥 4 (+) L: _____ R: _____ (-) L: _____ R: _____ h) 𝑦 = 𝑥 8 𝑦 = −𝑥 8 (+) L: _____ R: _____ (-) L: _____ R: _____ Writing: Compare the graphs above. What patterns do you notice? Which functions had matching end-behaviors (upup or down-down)? Which functions had opposite end-behaviors (updown or down-up)? What does the negative determine about the end behavior of a function? **Any other observations you made: 2 Practice: Use your calculator to sketch a graph of each polynomial function (adjust the WINDOW to see the key features). Determine the end behavior. (direction @ far left - far right). 1. 𝑦 = −4𝑥 2 2. 𝑦 = −5𝑥 3 + 9 3. 𝑦 = −4𝑥 4 4. 𝑦 = −8𝑥 5 − 1 End Behavior: ________________ End Behavior: ________________ End Behavior: ________________ 5. y = 3x4 + 6x3 x2 + 12 6. y = 50 3x3 + 5x2 End Behavior: ________________ End Behavior: ________________ End Behavior: ________________ 8. y = 12x4 x + 3x7 1 9. y = 5 + 2x + 7x2 5x3 End Behavior: ________________ End Behavior: ________________ End Behavior: ________________ 7. y = x + x2 + 2 10. y = 20 5x6 + 3x 11x3 VOCABULARY: the lead coefficient is the coefficient on the term of highest degree (largest exponent term) **Circle the lead term on each function above** Using all graphs so far, complete the chart describing rules for the end behavior (left-right) of polynomials. 3 Key Concept: The degree of a polynomial affects the shape of the graph, end behavior, and maximum number of turning points! VOCAB: Turning Points - places where the graph changes directions (increasing vs. decreasing) also known as local maximums and/or local minimums or relative max/min *For a polynomial with degree n, (𝑛 ≥ 1) there can be at most 𝑛 − 1 turning points** If there are no turning points, the graph is either increasing or decreasing from _______ to _______. How can you use your calculator to determine a relative maximum or minimum from a polynomial graph? **We use the maximum/minimum to identify intervals of x where the function is increasing or decreasing. (The maximum or minimum tells us a turning point!) Example #1: From left to right, the graph is decreasing when x is from ______ to _____. At the local minimum (-1, -1) it changes directions and is increasing when x is between ____ and ____. Then, the graph changes directions again at the local maximum (2, 2) and is decreasing when x is from ___ to ____. Increasing Interval(s): Decreasing Interval(s): Practice: Sketch a graph of each function. Describe the shape including end behavior, turning points (local max/min), and increasing/decreasing intervals (in terms of the x values). Example #2: 𝑓(𝑥) = 2𝑥 3 − 5𝑥 2 + 1 End behavior: __________________ (turning point) Local Maximum:________________ (turning point) Local Minimum: _______________ Increasing Interval(s): - describe x using inequality statements Decreasing Interval(s): - describe x using inequality statements 4 1. 𝑓(𝑥) = 3𝑥 3 − 𝑥 − 3 End behavior: _______________ (turning point) Local Maximum:_____________ (turning point) Local Minimum: ____________ Increasing Interval(s): - describe x using inequality statements Decreasing Interval(s): - describe x using inequality statements 2. 𝑓(𝑥) = −9𝑥 3 − 2𝑥 2 + 5𝑥 + 3 End behavior: _______________ (turning point) Local Maximum:_____________ (turning point) Local Minimum: ____________ Increasing Interval(s): - describe x using inequality statements Decreasing Interval(s): - describe x using inequality statements 3. 𝑓(𝑥) = −0.5𝑥 4 + 𝑥 3 + 3𝑥 2 End behavior: _______________ (turning point) Local Maximum:_____________ (turning point) Local Minimum: ____________ Increasing Interval(s): - describe x using inequality statements Decreasing Interval(s): - describe x using inequality statements 5 Using what you know about end behavior, degree, and turning points: Writing: Why is it easiest to determine the degree, end-behavior, and maximum number of turning points from standard form? Use an example to support your answer. Do MathXL 5.1 6

