Poisson’s distribution and Gaussian distribution of
radioactive decay with Cobra4 – Influence of the
dead time of the counter tube
TEP
Related topics
Poisson’s distribution, Gaussian distribution, standard deviation, expected value of pulse rate, different
symmetries of distributions, deadtime, recovering time and resolution time of a counter tube.
Principle
1) The aim of this experiment is to show that the number of pulses counted during identical time intervals
by a counter tube which bears a fixed distance to a long-lived radiation emitter correspond to a Poisson’s
distribution. A special characteristic of the Poisson’s distribution can be observed in the case of a small
number of counts n <20: The distribution is unsymmetrical, i.e. the maximum can be found among smaller numbers of pulses than the mean value. In order to show this unsymmetry the experiment is carried
out with a short counting period and a sufficiently large gap between the emitter and the counter tube so
that the average number of pulses counted becomes sufficiently small.
2) Not only the Poisson’s distribution, but also the Gaussian distribution which is always symmetrical is
very suitable to approximate the pulse distribution measured by means of a long-lived radiation emitter
and a counter tube arranged with a constant gap between each other. A premise for this is a sufficiently
high number of pulses and a large sampling size. The purpose of the following experiment is to confirm
these facts and to show that the statistical pulse distribution can even be approximated by a Gaussian
distribution, when (due to the dead time of the counter tube) counting errors occur leading to a distribution which deviates from the Poisson’s distribution.
3) If the dead time of the counter tube is no longer small with regard to the average time interval between
the counter tube pulses, the fluctuation of the pulses is smaller than in the case of a Poisson’s distribution. In order to demonstrate these facts the limiting value of the mean value (expected value) is compared to the limiting value of the variance by means of a sufficiently large sampling size.
Material
1
1
1
1
1
1
1
1
1
1
Cobra4 Wireless Manager
Cobra4 Wireless-Link
Cobra4 Sensor-Unit Radioactivity
Base plate for radioactivity
Counter tube holder on fix.magn.
Source holder on fixing magnet
Geiger-Mueller Counter tube, type A, BNC
Screened cable, BNC, l = 750 mmr
Radioactive source Am-241, 370 kBq
Software Cobra4 - multi-user licence
12600-00
12601-00
12665-00
09200-00
09201-00
09202-00
09025-11
07542-11
09090-11
14550-61
Additionally required
1 PC with USB-Interface, Windows XP or higher
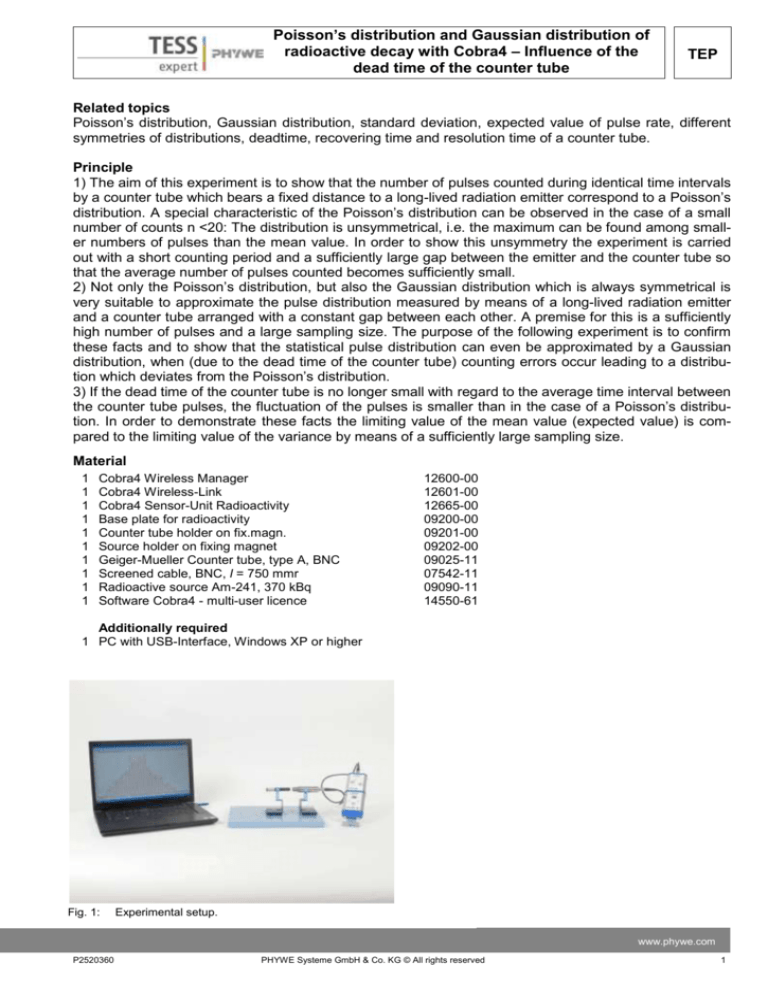
Fig. 1:
Experimental setup.
www.phywe.com
P2520360
PHYWE Systeme GmbH & Co. KG © All rights reserved
1
TEP
Poisson’s distribution and Gaussian distribution of
radioactive decay with Cobra4 – Influence of the dead
time of the counter tube
I Poissons’s distribution
Setup and procedure
Connect the Cobra4 Wireless Manager to a USB port of the computer and plug the Cobra4 SensorRadioactivity on the Cobra4 Wireless-Link.
Set up the equipment according to Fig. 1. Start the “measure” program on your computer and load the
experiment (Experiment > Open experiment). All pre-settings that are necessary for measured value recording are now carried out.
The first step is to adjust the gap between the radioactive source and the counter tube as well as the
counting time such that an average pulse rate of about 1…3 results.
The following preliminary experiment must be carried out:
— Place the radioactive source about 5 cm away from the admission opening of the counter tube.
— Check the measured value. If necessary, change the gap between the
radioactive source and the counter tube in order to obtain the desired
number of counts. To get low pulse rates, it will be helpful to put a sheet of
paper between the source and the counter tube. Then a series of measurements (sampling size 1000) is carried out with the aid of experimental
equipment and setup used for the preliminary experiment. Click on
in
the icon strip to start the measurement. It will automatically stop after 1000
Fig.. 2: Saving measurements.
s. Now send the measurement to measure (Fig. 2).
Repeat the measurement with larger number of counts (reduce the gap; if
necessary, increase the counting periode), for instance for
an average of 5, 10 and 20 pulses per counting interval.
After recording of each spectrum select the following parameters in the ”Analysis” ”Interval plot” window (see Fig.3):
Analyse left axis
Interval width 1 #/1s
After conversion of the measured values you will receive the
distribution of the number of events shown in Fig. 4 as a
function of counts per 1 sec intervals. Enter the following parameters
in the Measurement / Display options / x-Data window:
Title: Counts
Symbol: Counting
Unit: #/1sec
Digits beyond point: 3
in the Measurement / Display options / Channels window:
Title: Frequency
Symbol: Events
Unit: #
Digits beyond point: 3
Fig. 3:
Conversion of the measured values.
Fig. 4:
Distribution of the number of counts with an
average number of 1 pulses per 1 sec.
Theory and evaluation
Figure 4 shows the distribution measured first. It becomes very clear that the distribution is unsymmetrical, i.e. the counts with a maximum frequency are on the left of the middle between the minimum number of counts and the maximum number of counts.
Figure 5 shows a comparison of the four measured statistical distributions. With the aid of the program
function ”Analysis” ”Function fitting” ”Scaled Poisson distribution” a theoretical curve of the Poisson’s distribution was adapted to the measured pulse rate distribution. It becomes clear that the unsymmetry decreases with an increasing number of pulses.
2
PHYWE Systeme GmbH & Co. KG © All rights reserved
P2520360
Poisson’s distribution and Gaussian distribution of
radioactive decay with Cobra4 – Influence of the
dead time of the counter tube
TEP
Figure 6 shows the same measured distributions together with an adapted Gaussian curve so that the
degree of unsymmetry of the measured distributions can be verified. It can be seen clearly that the approximation of the symmetrical Gaussian distribution is worse than that of the Poisson’s distribution as
far as the first three measurements are concerned. The maximum of the Gaussian distribution is located
too far on the right. In the case of the fourth measurement (mean value 20.3) the differences are far less
distinctive. In case of a large sampling size the probability P(N) according to which N pulses are counted
̅:
is a function of the expected number of pulses which in this case can be replaced by the mean value 𝑁
𝑃(𝑁) =
̅𝑁
𝑁
∙ 𝑒 −𝑁̅
𝑁!
̅ always
This is the so-called Poisson’s distribution which regardless of the average number of counts 𝑁
applies for radioactive decays.
Fig. 5:
Comparison of the pulse rate distributions for different Fig. 6:
average numbers of counts and the theoretical curves
of the corresponding Poisson’s distributions.
Comparison of the pulse rate distributions for different
average numbers of counts and the theoretical curves
of the corresponding Gaussian distributions.
II Gaussian distribution of radioactive decay
Setup and procedure
The experiment is set up as shown in part I.
The second measurement of this experiment requires a sufficiently strong radioactive source with the aid
of which pulse rates of more than 3000 pulses/s can be reached. These high pulse rates can be reached
by means of an α-emitter since the counter tube responds strongly to these particles. The 241Am-source
09090-11 (370 kBq) which must be arranged very closely to the admission opening of the counter tube is
very suitable for this purpose.
Two different measurements must be carried out. During the first measurement the pulse rate must not
exceed 100 pulses/s in order to guarantee that the dead time of the counter tube (about 0.1 ms) has no
falsifying effect on the result. The average number of counts per counting procedure should be more
than 50…100 pulses so that a Gaussian adaptation is possible. The pulse rate for the second measurement should be at least 3000 pulses/s in order to be able to underline the decrease in fluctuation which
is due to the influence of the dead time.
The first step is to adjust the gap the between the radioactive source and the counter tube such that an
average pulse rate of about 50…100 pulses/s results. The following preliminary experiment must be carried out for this purpose:
— Place the radioactive source about 5 cm away from the admission opening of the counter tube.
— Check the measured values. If necessary, change the gap between the radioactive source and the
counter tube in order to obtain an average number of counts of 50…100.
www.phywe.com
P2520360
PHYWE Systeme GmbH & Co. KG © All rights reserved
3
TEP
Poisson’s distribution and Gaussian distribution of
radioactive decay with Cobra4 – Influence of the dead
time of the counter tube
Then a series of measurements (sampling size 1000) is carried out with the aid of experimental equipment and set-up used for the preliminary experiment.
The second measurement must be carried out with the shortest distance possible between the radioactive source and the Geiger-Müller counter. Caution: If the radioactive source comes into direct contact
with the admission opening of the counter tube, the counter tube might be destroyed. It is recommended
to increases the end value of the Y-scale, e.g. to 200. Then the second measurement is carried out in
the same way as the first one.
Theory and evaluation
Figure 7 shows a pulse rate distribution
which is sufficiently approximated by the
added Gaussian curve. This figure shows
that the Poisson’s curve in the right window
is nearly identical with the Gaussian curve
in the left window.
However, the strong statistical fluctuations
of the frequencies have a disturbing influence on the typical form of the Gaussian
distribution. The sampling size of 1000
seems still to be too small to obtain a sufficiently smooth distribution.
It can be seen that a Gaussian curve can
be easily adapted to this distribution, too.
However, in this case the Poisson’s distribution in the right window does not match the
measured distribution since due to the dead
time of the counter tube the fluctuation of
the number of counts is smaller than the
value which is typical of a Poisson’s distribution (see fig. 8).
In the case of a large sampling size and a
sufficient number of counts the probability
P(N) according to which N pulses are
counted can not only be described by the
unsymmetrical Poisson’s distribution, but also with the aid of the symmetrical Gaussian
distribution:
𝑃(𝑁) =
Fig. 7:
Pulse rate distribution for low pulse rate (75 pulses/s) with an adapted
Gaussian curve (left window) and a Poisson’s curve (right window).
Fig. 8:
Pulse rate distribution for high pulse rates (281 pulses/s) with an adapted
Gaussian curve (left window) and a Poisson’s curve (right window).
1
√2𝜋 ∙ 𝜎
𝑒𝑥𝑝 − (
̅)2
(𝑁 − 𝑁
)
2 ∙ 𝜎²
(1)
with σ being the standard deviation. The Gaussian curve represented by means of (1) adapts to the
symmetrical distributions with various fluctuations which are described by the standard deviation σ.
Thus, the Gaussian distribution is of great importance for describing statistically straggling data of the
most various kinds. As far as the radioactive decay is concerned the standard deviation is given as the
̅ in the case of a large sampling size (expected value). 𝜎 = √𝑁
̅ so that the general equameans value 𝑁
tion (1) is transformed into the following special form:
𝑃(𝑁) =
4
1
̅
√2 ∙ 𝜋 ∙ 𝑁
𝑒𝑥𝑝 − (
̅ )2
(𝑁 − 𝑁
)
̅
2∙𝑁
PHYWE Systeme GmbH & Co. KG © All rights reserved
(2)
P2520360
Poisson’s distribution and Gaussian distribution of
radioactive decay with Cobra4 – Influence of the
dead time of the counter tube
TEP
With the aid of several calculation procedures (conversion of N! by means of Stirling’s formula and then
an expansion into a series) it can be shown that in the case of large numbers of counts the Poisson’s
distribution represented by the formula (3) changes into the Gaussian distribution (2).
𝑃(𝑁) =
̅𝑁 ̅
𝑁
𝑒 −𝑁
𝑁!
(3)
Instead of explaining the mathematical derivation we would like to show how the agreement between the
two distributions can be verified by means of the computer and a spread-sheet analysis program like, for
instance, MS-Excel. In order to obtain the diagrams for the two distributions the corresponding formulas
(2) and (3) must be entered. Figure 9 compares the resulting Gaussian distribution (complete line) with
̅ = 50. It can be clearly seen that the two distrithe Poisson’s distribution (squares) for a mean value of 𝑁
butions only differ from each other to a very slight extent.
Fig. 9:
Gaussian distribution (complete line) and Poisson’s distribution
(squares) obtained with the aid of a spreadsheet analysis program.
III Influence of the dead time of the counter tube on the pulse distribution
Setup and procedure
The experiment is set up as shown in part I.
The experiment requires a sufficiently strong radioactive source with the aid of which pulse rates of more
than 3000 pulses/s can be reached. These high pulse rates can be reached by means of an α-emitter
since the counter tube responds strongly to these particles. The 241Am-source 09090-11 (370 kBq) which
must be arranged very closely to the admission opening of the counter tube in very suitable for this purpose.
For the first measurement the radioactive source must be placed as closely in front of the counter tube
as possible. Caution: A direct contact between the source and the counter tube might destroy the counter tube!
— Place the radioactive source as closely in front of the admission opening of the counter tube as possible.
Then a series of measurements with larger gaps between the radioactive source and the counter tube,
e.g. with smaller average pulse rates, are carried out as described above. If an α-emitter is used as recommended, it must be considered that variations of the distance between the source and the counter
tube have a strong influence on the counting rate. It is thus of great importance to adjust the distance
www.phywe.com
P2520360
PHYWE Systeme GmbH & Co. KG © All rights reserved
5
TEP
Poisson’s distribution and Gaussian distribution of
radioactive decay with Cobra4 – Influence of the dead
time of the counter tube
very carefully in order to obtain the desired pulse rates. In order to be able to compare the results each
measurement is asigned to an own window.
Theory and evaluation
Fig. 10 shows the results of the measurements with the pulse rates 248, 207, 83 and 9 pulses/s.
Fig. 10: Statistical distribution for average pulse rates of 248,207,83 and 9 pulses/s compared to the
theoretical Poisson’s distribution.
The fluctuation is clearly smaller for the two measurements mentioned first than it could be expected for
a Poisson’s distribution. This phenomenon is directly shown in figure 10. This figure shows the series of
measurements together with the theoretical Poisson’s distribution (”Analysis” ”Function fitting” ”Scaled
Poisson distribution”) corresponding to the calculated mean value. The deviations between the limiting
values of variance and mean value show that due to the limited resolving time tress of the counter tube a
part of the pulses could not be counted. In fact, the measured pulses ought to be corrected to a bigger
value. The resolving time is slightly longer than the so-called dead time of the counter tube. The dead
time of the counter tube used for this experiment is in the order of about 0.1 ms. The probability that a
pulse directly follows an already counted pulse within the resolving time and thus cannot be counted is:
𝑃 = 1 − 𝑒 −𝑁̇∙𝑡𝑟𝑒𝑠 = 𝑁̇ ∙ 𝑡𝑟𝑒𝑠 𝑓𝑜𝑟 𝑁̇ ∙≪ 1.
In the case of a resolving time of 0.1 ms and an average counting rate of 𝑁̇ = 100 s-1, for instance, this
probability is in the order of magnitude of 1%, in the case of 𝑁̇ = 1000 s-1, however, it already reaches
about 10%.
This error of measurement which is due to the dead time of the counter tube can have a strong falsifying
effect, e.g. when the dependence of the radiation intensity of a g-emitter on the distance between the
source and the counter tube is measured, especially in the case of short distances. The comparison of
the limiting values of variance and standard deviation described in this experiment is a reliable indicator
for such counting errors.
6
PHYWE Systeme GmbH & Co. KG © All rights reserved
P2520360


