Molecular dynamics simulation for the effect of ultrasound applying to animal cells
Yan Duan September 2nd 2013
Note: First I have to claim that this simulation is a revised version based on the team from Tohoku
University.
The simulation is about to describe the process that when ultrasound is applied to animal cells in
solvent (water), what would be happening to their cell membranes. From the paper of Tohoku
University[1], we do expect to observe penetrations of water molecules into the cell
membrane/lipid bilayer as the ultrasound is applied. The whole simulation could be classified
into 3 parts:
Part I: Penetration of water molecules
1) The model of applied ultrasound
The ultrasound wave is regarded as a kind of momentum (or shock impulse), with momentum
𝑡
per unit area defined to be: 𝐼 = ∫0 𝑃(𝑡)𝑑𝑡, that is, the accumulated pressure over time t (which is
the effective time of applying ultrasound, in our case it's 200us), with knowing that the sound
power of the ultrasound in our lab is 30mW/cm2(or 300W/m2), we can easily calculate the sound
𝐼
)
10−12
20
10×𝑙𝑜𝑔(
−5
pressure P using the formula: 𝑃 = 2 × 10
× 10
𝑃𝑎=346Pa, thus the impulse I is
estimated to be: I=346Pa*200us=0.069Pa.s. By assuming that all the momentum is absorbed by
water molecules, thus ultrasound wave could assign high velocities v to water molecules: 𝑣 =
𝐼×𝐴
𝑚𝑁
(1), m is the mass of water molecule (3*10^-26kg) and N is the number of molecules in a
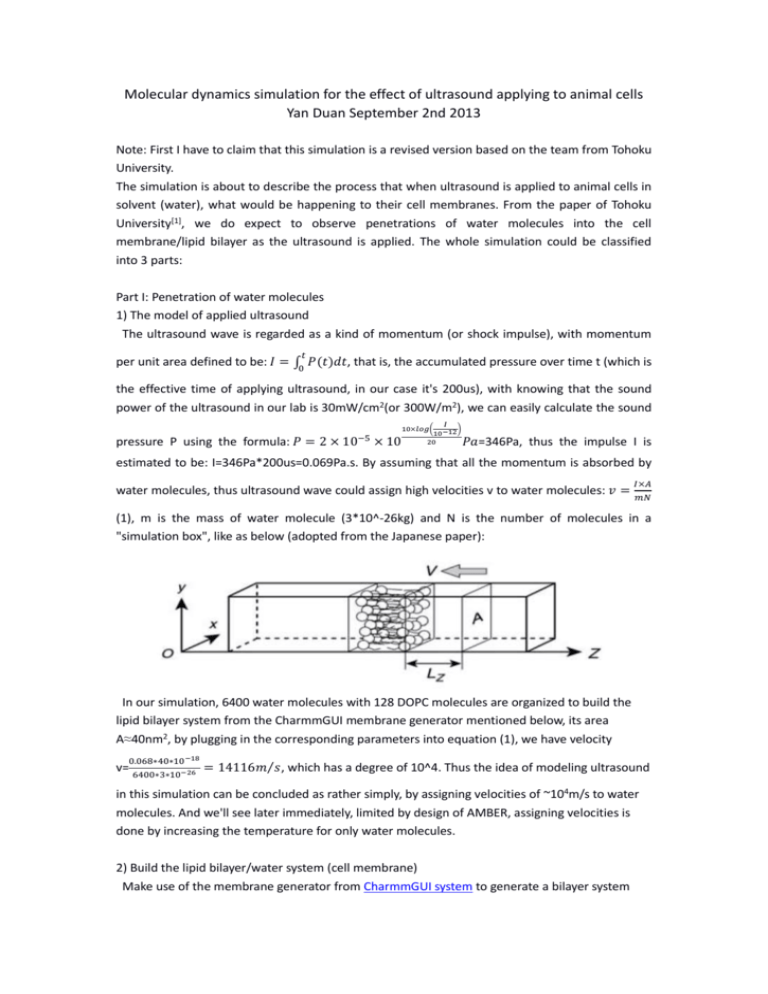
"simulation box", like as below (adopted from the Japanese paper):
In our simulation, 6400 water molecules with 128 DOPC molecules are organized to build the
lipid bilayer system from the CharmmGUI membrane generator mentioned below, its area
A≈40nm2, by plugging in the corresponding parameters into equation (1), we have velocity
0.068∗40∗10−18
v=
6400∗3∗10−26
= 14116𝑚⁄𝑠, which has a degree of 10^4. Thus the idea of modeling ultrasound
in this simulation can be concluded as rather simply, by assigning velocities of ~104m/s to water
molecules. And we'll see later immediately, limited by design of AMBER, assigning velocities is
done by increasing the temperature for only water molecules.
2) Build the lipid bilayer/water system (cell membrane)
Make use of the membrane generator from CharmmGUI system to generate a bilayer system
with 128 DOPC molecules and 6400 water molecules on their two sides. (Note: although larger
number of molecules could generate more precise simulation result, due to the long time of one
trial simulation, this number of molecules is preferred for the balance of efficiency and precision)
First we need to log into the Charmm-GUI website and click the "input generator" section, by
choosing membrane builder-bilayer builder:
since our simulation doesn't involve proteins, we choose "Membrane only system":
Then click next step.
Choose heteogeneous lipid, which is more close to real case, keep the box type to be rectangle,
then choose the hydration number for length Z based on (I chose this simply because its
conception is more quantitatively clear), and choose the Length of XY based on numbers of lipid
components, which is consistent with above:
For normal convention of defining lipid system in simulation, here we define 128 DOPC molecules
to be combined as the bilayer system for test, that is 64 DOPC molecules for both upper and
lower side:
For the surface area, just keep them as default. Then click "show molecule info" to update the
new information. Then click "next step".
For the next step it's about defining the ions in the system, for the first sets of simulation we
only concentrate on pure lipid with water solvent, we'll talk about this in Part II. So just keep
everything as default and uncheck the "include ions" option. Click "next step" to step 3.
After some time of computation for Charmm-GUI's online system, now we're able to obtain
the .pdb file from Charmm-GUI, just download the .pdb file named step5_assembly.pdb.
Due to the fact that the .pdb file generated from Charmm-GUI system can not be accepted by
the lipid 11 force field we would mention in details below, we do have to use a program in amber
tools to convert the charmm-format to lipid11-format, in terminal in Linux type:
charmmlipid2amber.x input_structure.pdb output_structure.pdb
Finally we got a .pdb file describing the system's topology and atom types, and its original state
could be shown graphically in VMD as follows:
Graph 1: the original state of lipid bilayer system
As shown above, the middle parts (grey and yellow) are the lipid, which consist of 128 DOPC
molecules, and on its two sides the water parts (blue) stand for 6400 water molecules in total.
3) Simulation in AMBER 12[2]
By using the AMBER 12 from Westgrid system, the AMBER software is able to generate 2 initial
output files from the .pdb file mentioned above: .prmtop file which describes the topology of the
system's structure, and .inpcrd file which contains the information of the atoms in the system.
This is done by using the LEap program in Amber, type "xleap" (GUI mode) or "tleap" (text mode)
in Amber directory, then apply the force field:
> source leaprc.ff99SB
> source leaprc.lipid11
The ff99SB force field was a general one describing fundamental organic molecules, as we'll see
later on, for bilayer system with ions, a different background force field has to be loaded.
Then load the .pdb file, set the topology center and finally generate the .prmtop and .inpcrd file:
> name = loadPdb XXXX.pdb
> setBox name centers
> saveAmberParm name XXXX.prmtop XXXX.inpcrd
If the two files could be generated without error (usually it will if we choose an unsuitable force
field above), by inputing these 2 files, along with another control file containing the information
describing the background parameters (like simulation time, temperature, etc), AMBER could run
the simulation mainly described by the control file to generate a bunch of files that contain the all
kinds of information of the simulation results: atoms' coordinates, velocities, trajectories, etc.
Among them the .mdcrd file, or the molecular dynamics coordinate file, is used to reproduce the
trajectories of atoms during the simulation.
Now we're ready to run the simulation, but before that we need to define the control file, which
is like command lines to control a program, simulation parameters (like temperature, simulation
time) have to be written in the control file to pre-define the simulation environment. Also by
writing specific command lines between "&wt" part, changing parameters during the simulation
process could also be define.
For the control file is the core that describes the whole simulation, I'll emphasize a little bit on
this, the following is a sample control script for the simulation:
&cntrl
imin=0,
ntx=5,
# Positions and velocities read formatted
irest=1,
# Restart calculation
ntc=2,
ntf=2,
tol=0.0000001,
nstlim=50000, # Number of MD steps
ntt=3,
gamma_ln=1.0,
ntr=1,
ig=-1,
ntpr=100,
ntwr=10000,
ntwx=100,
dt=0.002,
nmropt=1,
ntb=2,
# Constant pressure periodic boundary conditions
ntp=2,
# Anisotropic pressure coupling
taup=2.0,
# Pressure relaxation time (ps)
cut=10.0,
ioutfm=1,
/
&wt
type='TEMP0',
istep1=0,
# Initial step
istep2=50000, # Final step
value1=100.0, # Initial temperature (K)
value2=300.0, # Final temperature (K)
/
&wt
type='END'
/
Lipid restraint
10.0
RES 1 384
END
END
As we could see above, the scripts between the notation &ctrl and &wt basically set the global
background parameters of the input files for simulation, like how many steps AMBER would write
into the output file, would this simulation make use of the results of previous ones, etc.
After the “&wt” notation the scripts showed the running time and temperature settings. Above
we mentioned that we need to assign velocities of around 10^4 m/s to the water molecules,
basically this could be done in two ways:
(1) By modifying the .inpcrd file, we already know that the .pdb file describes the
topology/coordinates information of the system, and .prmtop and .inpcrd file could be seen as
"sons" of the .pdb file that inherit all its information. Since the .inpcrd file alone records the
coordinates of the atoms and (optionally) their velocities, although It's indeed possible to assign
a velocity to each water molecule, but still it's quite advanced to be done since there are several
severe problems to consider: if the velocities are not assigned appropriately, the water molecules
would not be density equilibrated, this could cause a fatal error during the simulation.
PS: after the first round of simulation, I did try to use this method to modify the .inpcrd directly
though, indeed I figured out where to put velocities' values correctly in .inpcrd file, thus I wrote a
small program using Python to replace thousands of lines' velocities information with my desired
velocities, however, still I didn't manage to make Amber accept the modified file, although I
didn't come across errors like unequilibrated densities, still I did face extremely difficult to work it
through, a detailed explanation was provided in my Aug 27th weekly report:
"Amber, compared with other commercial large scale simulation software (like Comsol
Multiphysics I used for Scott's project), which is highly unified and all the math models can
communication with each other following same protocols, Amber itself is merely a distribution of
several standalone software packages altogether. This is not a big problem when people apply
molecular dynamics simulation in a "normal" way, that is to investigate the static properties of
molecular-scale phenomenon, whose solutions are solved based on equilibrium states, but for
dynamic analysis, this characteristic could be fatal since dynamic states usually involve multiple
force fields. For some force fields Amber developers did incorporate dynamic states, but for some
too specific force field, they don't yet. In this "water molecules striking cell membrane/lipids"
simulation, I used the lipid11 force field, which is the only choice now, to assign velocities directly
to water molecules, I had to modify the .inpcrd file, which is generated based on the chosen force
field, thus I believe that it's because of the lipid11 force field that my velocities information could
not be read, since this specific force field is not compatible to dynamic analysis. Differently, if I
simply increase the temperature to assign velocities, since the corresponding velocities are
automatically assigned by the simulator, the problem for the force field could be avoided. Indeed
Amber is a widely used MD software nowadays, but based on my user experience, this software
package usually involves bugs that even developers' group could not answer clearly, this is mostly
due to the poor communication for different softwares in this big package. Thus I think one
possible solution for this simulation problem is to "start from 0", since the physics behind
molecular dynamics is not complicated at all: simply three Newton's Laws, and this simulation
only involves 3 types of van der wals forces: lipid-lipid, water-water, water-lipid, it's rather likely
that people would write a Matlab program to simulate the whole, although there could be
tedious programming task."
2) Instead of the method above, changing the background temperature is an alternative way to
do this. In the trial simulation the final temperature was assigned to be 1300K, which could
provide water molecules with velocities of almost 10^4 m/s, knowing that the water molecule's
speed is proportional to the square root of temperature, and its speed at 300K is around 600m/s.
Thus with all the input files listed above, the simulation could be run on the westgrid system
(usually it takes up to a whole day to finish), and the resulting trajectory file .mdcrd (be careful
that for large .mdcrd file the AMBER would write it as netcdf, this caused me lots of trouble
before I figured this out) could be read by using VMD, and the following pictures show us the
states at different time (whole simulation length is 2ps or 2000fs)
Graph 2: t=0 fs
Graph 3: t=200 fs
Graph 4: t=600 fs
Graph 5: t=1000 fs
It's clear to see that with such high velocities (~10^4 m/s), the water molecules could penetrate
into the lipid bilayer, this does satisfy our original expectation.
4) Quantifying the final results
Finally we could make use of the integrated tools in VMD to quantify and analyze the results.
Basically the most important quantified analysis we'd like to generate is to figure out how many
water molecules are penetrated into the bilayer during the 2ps time of simulation. And the table
of number of water molecules penetrated vs. time is generated by Matlab:
Graph 6: number of penetrated water molecules vs. time (in fs)
Conclusion: from Graph 2 to Graph6, it’s clear to observe the penetration effect for water
molecules when ultrasound is applied to the cell membrane. By applying the molecular dynamics
simulation software AMBER 12, the results predict the penetration effect for water with applied
ultrasound. The next step might be to design and set an experiment to confirm the theoretical
effect predicted by our simulation.
Part II: Further step: penetration of bigger size: ions and glucose
As above we successfully simulate the penetration of water molecules, thus we estimate that
maybe for larger-size molecules/ions, we could possibly also observe penetration effect, however,
our estimation was wrong: by physically striking larger molecules and ions, the ultrasound could
not send them through the cell membrane.
Although the results were rather negative, here I'd still present my process that how to include
ions/glucose to lipid bilayer system in Amber 12, since due to the dissembling nature of Amber,
it's not straightforward at all to add other molecules/ions into the lipid system.
1) system with ions
First let's go back to the Charmm-GUI online system, on which we built the cell-membrane
system without any ion, it's still straight forward, just make sure that wanted ions are checked in
step 4 and enter the concentration of the ions. Below the system would show you the number of
ions we added in the bilayer system:
Following similar process we did for system without ions, a .pdb file describing the topology is
expected to be generated, however, still probably due to the incompatibility of Amber
programs, .pdb files with ions added can't be easily accessed. After some time's searching, I
found that probably due to the difference of different program edition, for the same ions (let's
regard Na+ and Cl- as examples), some program would read SOD and CLA respectively (like VMD,
the visualizing program), some program would read Na+ and Cl-, like LEap. I observed that the
original .pdb file from Charmm-GUI system contains SOD/CLA information:
To get it to be processed by LEaP file, I replaced SOD/CLA with Na+/Cl-, thus .prmtop/.inpcrd file
were generated successfully. Similarly, to get .prmtop with SOD/CLA included, I had to replace
them all back to Na+/Cl- to get the ions shown in the VMD program:
With this single bug fixed, all the other procedures for simulation are exactly the same as the
system without any ion, the use of LEaP program, the control file, nothing different.
Finally the simulation results were not very positive, considering the small size of the ions
(pretty much the same as or a little bigger than water molecules), with ultrasound applied, with a
high speed of between 5000m/s to 15000m/s the ions would simply vibrate up and down, being
restricted by the lipid force (probably van der walls forces), NONE of the polar ions were
penetrated through the lipid bilayer system, as shown by the video:
Although it's a little bit dissapointing that the simulation results were not as good as expected,
still I'm encouraged by the fact that the simulation from computer, based on some simple (only
newton's laws here) but tedious (a simulation usually run for longer than 3 hours) mathematics, a
small scale phenomenon could be predicted and investigated with reliable results. I believe this is
only a start, that I would apply my math and physics skills with further applications.
PART III: the penetration of even larger molecules: glucose
The glucose is even larger than the ions, thus the results of course were negative: if the Na+/Clions simply vibrate out there, then the glucose molecules really don't move much, with the
method of increasing temperatures. However, it's still worth mentioning the procedures to build
the bilayer system along with glucose, since the Charmm-GUI is not able to build such relatively
complicated system, here I used a program package called "packmol".
This software package creates an initial point for molecular dynamics simulations by packing
molecules in defined regions of space. The packing guarantees that short range repulsive
interactions do not disrupt the simulations. The great variety of types of spatial constraints that
can be attributed to the molecules, or atoms within the molecules, makes it easy to create
ordered systems, such as lamellar, spherical or tubular lipid layers.
By providing the coordinates of one molecule of each type, the number of molecules of each
type and the spatial constraints that each type of molecule must satisfy.
The building process was not complicated, simply by preparing both the .pdb files of glucose
and DOPC molecules, we're able to combine the two files into a bilayer/glucose system with
specific number of molecules:
tolerance 2.0
filetype pdb
output bilayer.pdb
structure water.pdb
number 500
inside box 0. 0. 28. 40. 40. 38.
end structure
structure palmitoil.pdb
number 50
inside box 0. 0. 0. 40. 40. 14.
atoms 31 32
below plane 0. 0. 1. 2.
end atoms
atoms 1 2
over plane 0. 0. 1. 12.
end atoms
end structure
And the whole system is generated like this, visualized by VMD:
Reference:
1: Structural Change in Lipid Bilayers and Water Penetration Induced by
Shock Waves: Molecular Dynamics Simulations Biophysical Journal Volume 91 September 2006
2198–2205
2: AMBER 12, all copy rights reserved-http://ambermd.org/
My best gratefulness To:
Xunchen Liu, Department of Chemical and Material Engineering, University of Alberta.
Morteza Chehel Amirani, Department of Mechanical Engineering, University of Alberta.
Dr. Jie Chen, my supervisor, University of Alberta.

