Supplement Figure 1 - Springer Static Content Server
advertisement
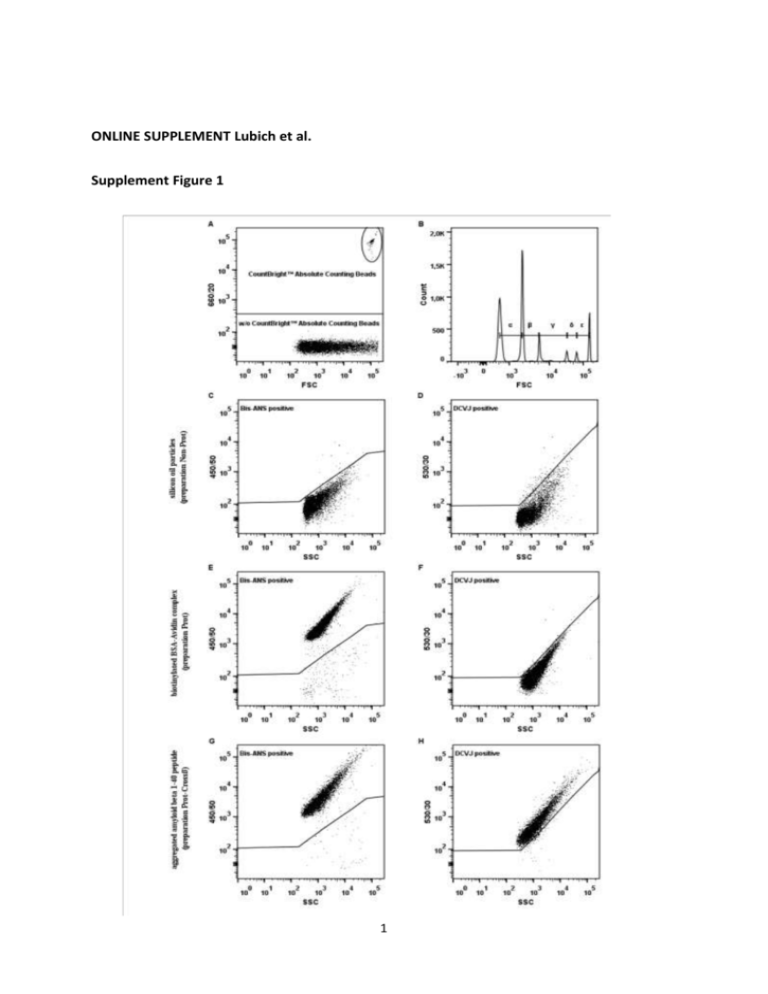
ONLINE SUPPLEMENT Lubich et al. Supplement Figure 1 1 Supplement Figure 1: General gating strategy Presented is a representative gating strategy of the flow-cytometry-based technology to analyze sub-visible particles in protein-based therapeutics. Size range gates were controlled and if needed corrected using Fluoresbrite® YG Carboxylate Size Range Kit I & II [A]. CountBright™ Absolute Counting Beads were gated out using the 660/20 band-pass filter in the red detector array [B]. Gating on protein sub-visible particles in the Bis-ANS channel (violet detector array, 450/50 band-pass filter) was done by acquiring a non-protein subvisible particle control (silicon oil particles, preparation Non-Prot) as a negative control reference [C] and protein sub-visible particle controls (biotinylated BSA-avidin complex, preparation Prot and aggregated amyloid beta 1-40 peptide, preparation Prot-Crossß) as positive controls [E and G]. Protein sub-visible particles bearing a cross-β-sheet structure were analyzed in the DCVJ channel (blue detector array, 530/30 band-pass filter) using preparation Non-Prot and preparation Prot as negative reference controls [D and F] for cross-β-sheet structures and preparation Prot-Crossß as a positive control [H]. All size range gates were applied for each staining gate. 2 Supplement Table 1A amyloid-like protein particles/ml particles/ml 1 2 3 4 5 6 2,903,406 2,889,310 2,595,874 3,108,448 3,093,660 2,784,400 2,350,739 2,338,488 2,688,654 CV % protein particles/ml run 10.32 % 2,666,654 CV % 1,765,834 10.36 % 2,495,028 3,101,138 3,086,665 2,963,407 2,700,258 2,690,203 2,486,555 CV % 16.32 % Supplement Table 1B run particles/ml CV % 1 2 3 4 5 6 2,999,795 2,862,464 2,939,847 3,072,418 2,740,746 2,855,702 3.92 % protein particles/ml 2,985,417 2,847,235 2,926,533 3,042,521 2,725,321 2,848,923 amyloid-like protein particles/ml 2,665,343 2,607,556 2,608,210 2,710,293 2,570,223 2,575,184 CV % 3.79 % CV % 2.05 % Supplement Table 1C 0.75µm-1µm run particles/ml 1 2 3 4 5 6 892,144 1,023,858 704,284 852,891 1,038,624 855,401 1µm-2µm CV % particles/ml 13.87 % 263,112 309,896 208,040 277,445 309,597 235,712 2µm-4.5µm CV % particles/ml 15.18 % 160,163 168,474 124,717 213,051 214,182 164,945 4.5µm-6µm CV % particles/ml 19.67 % 20,257 20,603 14,227 24,287 26,347 19,461 6µm-10µm CV % particles/ml CV % 20.13 % 10,314 11,359 7,938 11,561 14,780 10,014 20.56 % Supplement Tables 1A-1C: Precision and accuracy of the flow-cytometry based technology The precision of the method was evaluated by assessing the inter- and intra-assay variations. Aggregated amyloid beta 1-40 peptide (preparation Prot-Crossß) was used as a positive control for analyzing concentrations (in particles/ml) of total sub-visible particles, protein sub-visible particles and cross-β-sheet protein particles. We analyzed preparation ProtCrossß in 6 independent experiments for inter-assay variation [Table 1A] and in 6 parallel experiments on the same day for intra-assay variation [Table 1B]. Each sample was measured in 3 replicates in each experiment and mean numbers of sub-visible particles contained in 1 ml were calculated taking the dilution factor into account. This approach was used to calculate numbers of total sub-visible particles, protein and protein containing sub3 visible particles and cross-β-sheet protein particles. All mean values for the inter-assay and for the intra-assay were used to calculate the coefficient of variation (CV %) for each property. We observed that the CV % of all the properties tested ranged between 10.32 % and 16.32 % for the inter-assay variations and between 2.05 % and 3.92 % for the intra-assay variations. In addition, we tested the accuracy of the method regarding the size range gates by calculating the CV % of total sub-visible particle counts per ml for each size gate [Table 1C]. We met the acceptance criteria that were set to a maximum of 25 % for each CV which complies with regulatory guidelines [38, 39]. 4


