2nd and 3rd blocks
advertisement

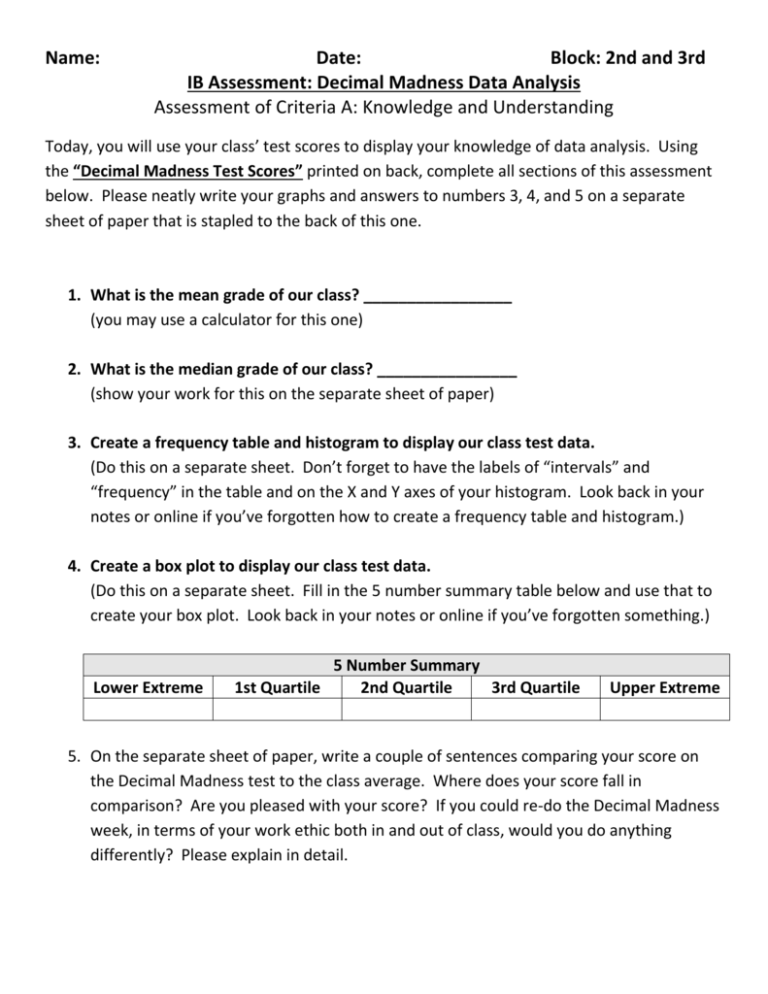
Name: Date: Block: 2nd and 3rd IB Assessment: Decimal Madness Data Analysis Assessment of Criteria A: Knowledge and Understanding Today, you will use your class’ test scores to display your knowledge of data analysis. Using the “Decimal Madness Test Scores” printed on back, complete all sections of this assessment below. Please neatly write your graphs and answers to numbers 3, 4, and 5 on a separate sheet of paper that is stapled to the back of this one. 1. What is the mean grade of our class? _________________ (you may use a calculator for this one) 2. What is the median grade of our class? ________________ (show your work for this on the separate sheet of paper) 3. Create a frequency table and histogram to display our class test data. (Do this on a separate sheet. Don’t forget to have the labels of “intervals” and “frequency” in the table and on the X and Y axes of your histogram. Look back in your notes or online if you’ve forgotten how to create a frequency table and histogram.) 4. Create a box plot to display our class test data. (Do this on a separate sheet. Fill in the 5 number summary table below and use that to create your box plot. Look back in your notes or online if you’ve forgotten something.) Lower Extreme 5 Number Summary 1st Quartile 2nd Quartile 3rd Quartile Upper Extreme 5. On the separate sheet of paper, write a couple of sentences comparing your score on the Decimal Madness test to the class average. Where does your score fall in comparison? Are you pleased with your score? If you could re-do the Decimal Madness week, in terms of your work ethic both in and out of class, would you do anything differently? Please explain in detail. Name: Date: Block: 2nd and 3rd IB Assessment: Decimal Madness Data Analysis Assessment of Criteria A: Knowledge and Understanding Grading Rubric Your paper should hit the following bullet points: o You correctly calculate the mean of your class data. o You correctly calculate the median of your class data. o You correctly create a 5 number summary and the box plot of the test data. o You correctly create a frequency table histogram of the test data. o Both graphs have the X and Y axes labeled with the proper units. o You honestly answer question #5. o Your paper is neat and orderly o You use complete sentences and proper grammar. Points 8 7 6 5 4 3 2 1 0 Explanation Your IB Assessment meets all 8 of the bullet points above. Your IB Assessment meets 7 of the 8 bullet points above. Your IB Assessment meets 6 of the 8 bullet points above. Your IB Assessment meets 5 of the 8 bullet points above. Your IB Assessment meets 4 of the 8 bullet points above. Your IB Assessment meets 3 of the 8 bullet points above. Your IB Assessment meets 2 of the 8 bullet points above. Your IB Assessment meets 1 of the 8 bullet points above. Your IB Assessment meets 0 of the 8 bullet points above, OR you didn’t turn anything in. Name: Date: Block: 2nd and 3rd IB Assessment: Decimal Madness Data Analysis Assessment of Criteria A: Knowledge and Understanding Decimal Madness Test Scores For the IB Assessment, use only the scores for YOUR BLOCK 1st Block (26 test scores): 88 64 94 70 94 76 82 76 64 51 94 76 70 94 58 88 58 76 82 58 64 94 64 52 82 64 100 100 94 100 94 100 94 100 70 100 94 82 100 100 100 100 94 100 100 100 94 100 88 100 94 82 82 94 82 100 70 94 100 88 94 82 76 94 100 76 82 100 94 82 82 2nd Block (32 test scores): 94 100 100 88 94 100 82 94 100 100 3rd block (33 test scores): 94 82 88 100 94 100 82 100 76 88 5th block (24 test scores): 88 100 70 64 76 82 70 82 76 94 82 76 76 64 82 46 94 76 76 76 82 64 94 88


