cen12489-sup-0001-SuppInfo
advertisement

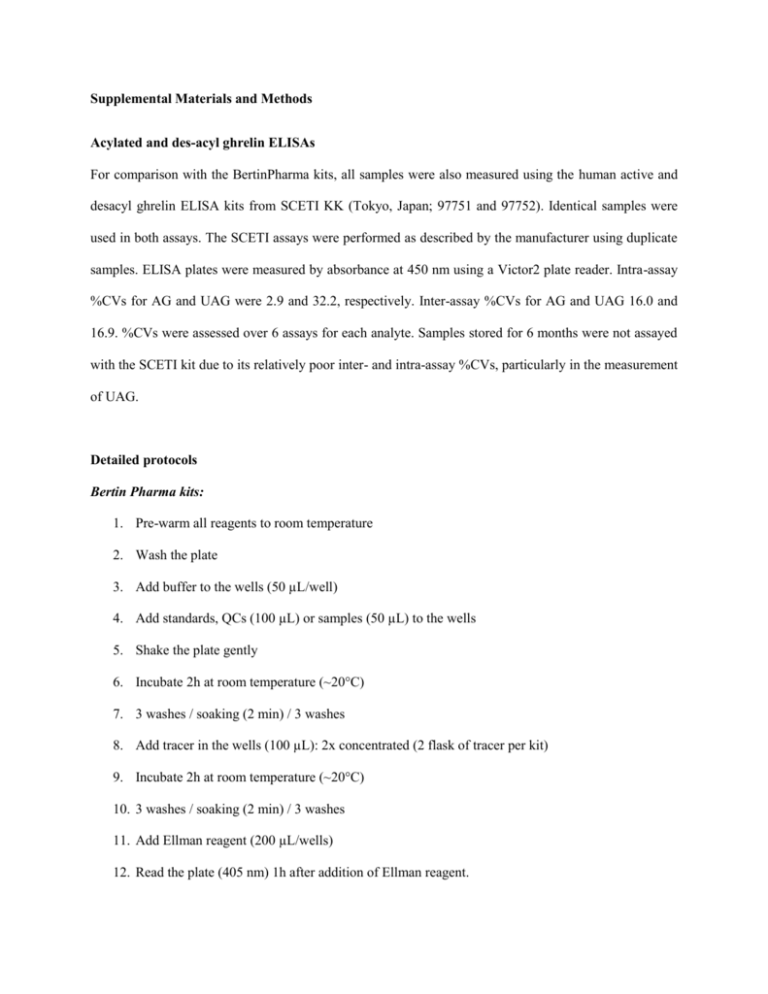
Supplemental Materials and Methods Acylated and des-acyl ghrelin ELISAs For comparison with the BertinPharma kits, all samples were also measured using the human active and desacyl ghrelin ELISA kits from SCETI KK (Tokyo, Japan; 97751 and 97752). Identical samples were used in both assays. The SCETI assays were performed as described by the manufacturer using duplicate samples. ELISA plates were measured by absorbance at 450 nm using a Victor2 plate reader. Intra-assay %CVs for AG and UAG were 2.9 and 32.2, respectively. Inter-assay %CVs for AG and UAG 16.0 and 16.9. %CVs were assessed over 6 assays for each analyte. Samples stored for 6 months were not assayed with the SCETI kit due to its relatively poor inter- and intra-assay %CVs, particularly in the measurement of UAG. Detailed protocols Bertin Pharma kits: 1. Pre-warm all reagents to room temperature 2. Wash the plate 3. Add buffer to the wells (50 µL/well) 4. Add standards, QCs (100 µL) or samples (50 µL) to the wells 5. Shake the plate gently 6. Incubate 2h at room temperature (~20°C) 7. 3 washes / soaking (2 min) / 3 washes 8. Add tracer in the wells (100 µL): 2x concentrated (2 flask of tracer per kit) 9. Incubate 2h at room temperature (~20°C) 10. 3 washes / soaking (2 min) / 3 washes 11. Add Ellman reagent (200 µL/wells) 12. Read the plate (405 nm) 1h after addition of Ellman reagent. 13. (Multiply concentration by 2 to adjust for 50 µL sample volume) SCETI kits 1. Pre-warm all reagents to room temperature 2. Add buffer to the wells (150 µL/well) 3. Add standards, QCs or samples to the wells (50 µL/well) 4. Shake the plate gently 5. Cover the plates with transparent sheet 6. Incubate 2h at room temperature (~20 °C) 7. 3 washes (300 µL per washing step, 1min incubation with washing buffer) 8. Tap plate on paper towel 9. Add diluted HRP to the wells (200 µL/wells) 10. Cover the plates with transparent sheet 11. Incubate 1h at room temperature (~20 °C) 12. 4 washes (300 µL per washing step, 1min incubation with washing buffer) 13. Tap plate on paper towel 14. Add substrate solution (200 µL/wells) 15. Incubate 30 min at room temperature (~20 °C) with shaking 16. Add stop solution (50 µL/well) 17. Shake the plate gently 18. Read the plate immediately at 450 nm 19. (Multiply concentration by 1.1 to adjust for HCl addition) Supplemental Figure Legends Supplemental Figure 1. AG and UAG levels measured in samples collected in EDTA tubes without [E] or with the addition of AEBSF alone [A], or AEBSF and Sigmafast protease inhibitor cocktail [A+S]. Samples were stored for 1 day at either -20 °C or -80 °C. AG and UAG levels measured with Bertin Pharma (A,B) or SCETI (C,D) assays. Supplemental Figure 2. AG and UAG levels measured in samples collected in EDTA tubes without [E] or with the addition of AEBSF alone [A], or AEBSF and Sigmafast protease inhibitor cocktail [A+S]. Samples were stored for 1 month at either -20 °C or -80 °C. AG and UAG levels measured with Bertin Pharma (A,B) or SCETI (C,D) assays. Supplemental Figure 3. AG and UAG levels measured in samples collected in EDTA tubes without [E] or with the addition of AEBSF alone [A], or AEBSF and Sigmafast protease inhibitor cocktail [A+S]. Samples were stored for 3 months at either -20 °C or -80 °C. AG and UAG levels measured with Bertin Pharma (A,B) or SCETI (C,D) assays. Supplemental Figure 4. AG and UAG levels measured in samples collected in EDTA tubes without [E] or with the addition of AEBSF alone [A], or AEBSF and Sigmafast protease inhibitor cocktail [A+S]. Samples were stored for 6 months at either -20 °C or -80 °C. AG and UAG levels measured with BertinPharma assays (A,B). Samples were not assayed with the SCETI kit due to its relatively poor interand intra-assay %CVs, particularly in the measurement of UAG. Supplemental Figure 5. AG and UAG levels measured with the SCETI ELISA. (A-D) AG levels measured in plasma from AEBSF and AEBSF+Sigmafast treated blood samples after 1 day (T0), or 1, 3 and 6 months (T1, T3, T6) storage at either -20 °C or -80 °C. (E-H) UAG levels measured in the same plasma samples. UAG concentrations were predominantly at the level of detection of the assay. Supplemental Figure 1 Supplemental Figure 2 Supplemental Figure 3 Supplemental Figure 4 Supplemental Figure 5


