Chapter 11
advertisement
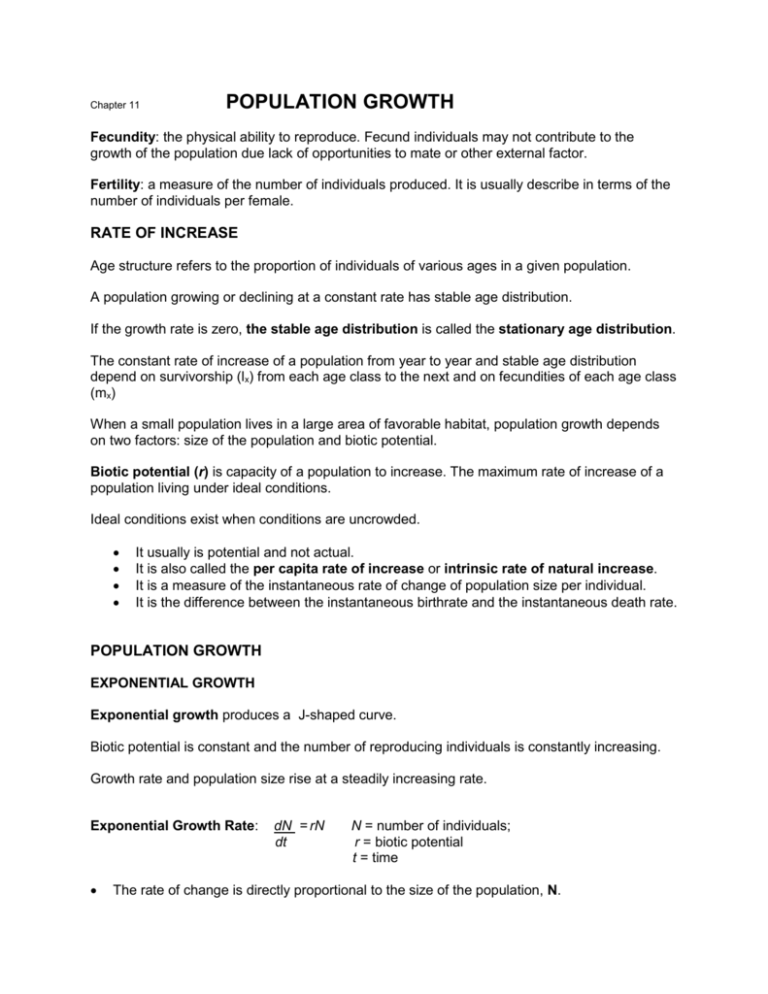
Chapter 11 POPULATION GROWTH Fecundity: the physical ability to reproduce. Fecund individuals may not contribute to the growth of the population due lack of opportunities to mate or other external factor. Fertility: a measure of the number of individuals produced. It is usually describe in terms of the number of individuals per female. RATE OF INCREASE Age structure refers to the proportion of individuals of various ages in a given population. A population growing or declining at a constant rate has stable age distribution. If the growth rate is zero, the stable age distribution is called the stationary age distribution. The constant rate of increase of a population from year to year and stable age distribution depend on survivorship (lx) from each age class to the next and on fecundities of each age class (mx) When a small population lives in a large area of favorable habitat, population growth depends on two factors: size of the population and biotic potential. Biotic potential (r) is capacity of a population to increase. The maximum rate of increase of a population living under ideal conditions. Ideal conditions exist when conditions are uncrowded. It usually is potential and not actual. It is also called the per capita rate of increase or intrinsic rate of natural increase. It is a measure of the instantaneous rate of change of population size per individual. It is the difference between the instantaneous birthrate and the instantaneous death rate. POPULATION GROWTH EXPONENTIAL GROWTH Exponential growth produces a J-shaped curve. Biotic potential is constant and the number of reproducing individuals is constantly increasing. Growth rate and population size rise at a steadily increasing rate. Exponential Growth Rate: dN = rN dt N = number of individuals; r = biotic potential t = time The rate of change is directly proportional to the size of the population, N. The biotic potential, r, combines the instantaneous birth rate with the instantaneous death rate. Exponential growth is not realistic; no population can grow indefinitely. Population size at various times during exponential growth can be projected with the formula: Nt = Noert Nt = number at time t No = number at time 0 e = base of natural log, 2.71828... t = period of time being studied r = biotic potential LOGISTIC GROWTH Exponential growth is not realistic. No population can grow indefinitely. There are limitations presented by the environment (food, space, etc), and competition for available resources increases. Increased density eventually increases mortality, decreases fecundity, and causes emigration. Logistic growth or sigmoid growth is exponential at first then growth begins to slow down until it reaches zero, when births balance deaths. Slow, fast, slow, zero growth. Environmental resistance modifies growth. S-shaped curve. It represents how populations respond to density. The biotic potential and size of the population modified by the environmental resistance determine the growth rate. Environmental resistance refers to the limitations placed on the biotic potential due to unfavorable environmental conditions, e.g. overcrowded, predation. Carrying capacity is the maximum number of individuals an area can support, K. The density of organisms is in equilibrium with the source supply, the environment. Undercrowding can be detrimental to a population since cooperation between members may be necessary. dN = rN (K - N) dt K N = number of individuals; r = biotic potential t = time K= carrying capacity dN = instantaneous rate of change dt (K - N) it is a measure of the environmental resistance or the effect of crowding. K this represents the opportunity for further population growth. As the population grows, this unutilized opportunity declines. This expression slows population growth. When N is small, K - N/K is close to 1. As N increases and approaches K, the value of the expression decreases towards 0. If N > K, then dN/dt is negative and the population N decreases toward K. Logistic growth curve is theoretical. It is a mathematical model of how populations grow under favorable conditions. Natural populations although they appear to grow logistically, they rarely do. Some reasons for this difference: age structure may not be stable, immigration or emigration, birth and death rate changed. TIME LAGS The effect of population increase or environmental resistance is not felt instantly in most cases. Available resources may allow a population to overshoot the carrying capacity or equilibrium point. Unable to sustain itself, the population declines to a point below the carrying capacity but not before it has altered resource availability for future generations. The previous generation builds a time lag that allows the population to overshoot equilibrium or to recover from a population crash. Population recovery as determined by reproductive rates is influenced by the density of the previous generation and the recovery of the resources, especially food supply. There is time lag before the effects are felt and the rate of growth is affected. dN = rNt-c _(K - Nt-w)_ dt K N = number of individuals; t = time r = biotic potential K= carrying capacity c = reproductive time lag that affects the population (maturity); a lag between environmental change and change in the length of gestation or its equivalent. w= reaction time lag between environmental change and corresponding change in the rate of population growth. Nt-c = population at an earlier time. Nt-w = effects of crowding are being felt not at the present size of the population (e.g. 450) but to the size of a population at an earlier time (e.g. 400). Time lags result in a population fluctuation. The population may fluctuate widely without any reference to equilibrium size. The fluctuation may be due to an extrinsic factor like weather. K may fluctuate around an equilibrium level rising and falling between an upper and lower limit. Example: Wandering Albatross: breeds at age 8-11; 1 chick; every other year; breed for 50 yrs. DENSITY-DEPENDENT RESPONSES TO GROWTH Populations do not increase indefinitely. Stability in the population is a sign that the population is being regulated by some factors. Because the environment is variable, K, the carrying capacity is also variable. The number of individuals the environment can support is variable. The carrying capacity is influenced by the most limiting resource. If that resource increases, then the carrying capacity increases. Populations are also influenced by disease, predation, habitat quality, bad weather, etc. The best estimate of K is obtained by averaging the population size over time, which provides a mean population size. Populations tend towards this equilibrium through density-dependent factors. Regulatory factors that depend on the density of the population are called density-dependent factors. Competition, stress (physiological changes), cannibalism and social organization are examples of density-dependent factors. As resources become less available to an increasing number of individuals, birthrate decreases, mortality increases, and a population growth slows. If individuals remove a resource faster than it is replaced, then the present population impoverishes the environment for the next generation, slowing population growth. If the population declines, mortality decreases, birthrate increases and the population increases again. Factors that affect population size but are not related to density are called densityindependent factors, e. g. floods, weather, and fires. POPULATIONS FLUCTUATIONS AND CYCLES Population fluctuations are usually a local phenomenon. A species may show stability over the whole of its range, but be highly variable locally. Populations fluctuate because of time lags in density dependent mechanisms. The carrying capacity of the environment during the most critical time of the year can influence population size during the breeding season. Resilience in the rate at which a population returns to equilibrium after a disturbance disrupts the balance between population and environment. Resilience is a measure of how fast the population declines from above equilibrium, and how quickly it increases from below equilibrium. Resilience is strongly influenced and sometime determined by the reproductive rate of the species. Large bodied animals are more stable around the equilibrium level because they live longer and are less subject to environmental changes. Very long-lived animals reproduce slowly and may require a substantial period of time to return to equilibrium. The longer the time, the less the resilience. Population fluctuations that are more regular than expected by chance are called oscillations or cycles. Population cycles are more common in the boreal forest and the tundra. Usually only local or regional populations are affected. 3 or 4 year cycles and 9 to 10 year cycles are the common ones. There are several hypotheses proposed to explain the population cycles but... "(i) abiotic factors and intrinsic mechanisms are unable to explain cycles; (ii) quantity and quality of food resources of the herbivore population have important effects on population dynamics, although plantherbivore interaction cannot explain the cycles by itself; (iii) predation is another important factor for these populations." H. Resit Akçakaya, Ecological Monographs 62:119-142 (1992) EXTINCTION A process of populations when the death rate and emigration is greater than the birth rate and immigration. The extinction of a species begins locally when the conditions when conditions of the habitat deteriorate. Change of conditions tilts the balance in favor of mortality. If the process of deterioration occurs fast, there is not enough time for populations to adapt to the changes taking place. Deterioration of the habitat. Emigration to new areas. Encounter with new habitats already occupied by other species. Competition in new habitat. Animals are pushed to marginal habitats not as well suited for the species. Fragmentation of the species into marginal habitats. Immigration becomes difficult and genetic isolation begins to occur. When the population falls below a minimum level, it may become extinct through random fluctuation of reproductive success. Plants have poorer dispersal ability than animals. Specialization is good as long as conditions do not change. e.g. restriction to a single habitat, to single type of food, to a stable environment. Species must specialize in order to avoid extinction from competitive exclusion. Human play an important role in the extinction of species. Extinctions are clustered in time. They are not evenly spread across the geologic history of the Earth. Our planet has been shaken by five major extinctions in the four billion-year history of life. The first occurred in the late Ordovician, 450 million years ago, shortly after the evolution of the first land-based plants and 100 million years after the Cambrian Explosion of animal life beneath the seas. The second extinction spasm came at the end of the Permian, 250 million years ago, causing the formation of coal forests. Then the Earth experienced two mass extinctions during the Triassic period, between 250 and 200 million years ago. The fifth mass extinction, probably caused by a giant meteor collision, occurred 65 million years ago, at the end of the Cretaceous period, and ended the reptilian dominance of the Earth. This led to the current mammalian domination of the Earth. There are two kinds of extinctions; Deterministic extinctions happen through a change from which there is no escape. Stochastic extinction comes about from normal random changes within the population or environment. These changes diminish the population and places at risk of extinction by another event. Stochastic events may be demographic or environmental. Demographic events are chance variations in individual births and deaths. It results from habitat deterioration and loss, reducing the population size and restricting individuals to local patches of habitat. When a population falls below a minimal viable size, it faces the risk of extinction. Environmental stochasticity is a random series of adverse environmental changes, which come about mostly through deterioration in environmental quality.
