Changing nitrate profiles under extreme hydrometeorological
advertisement

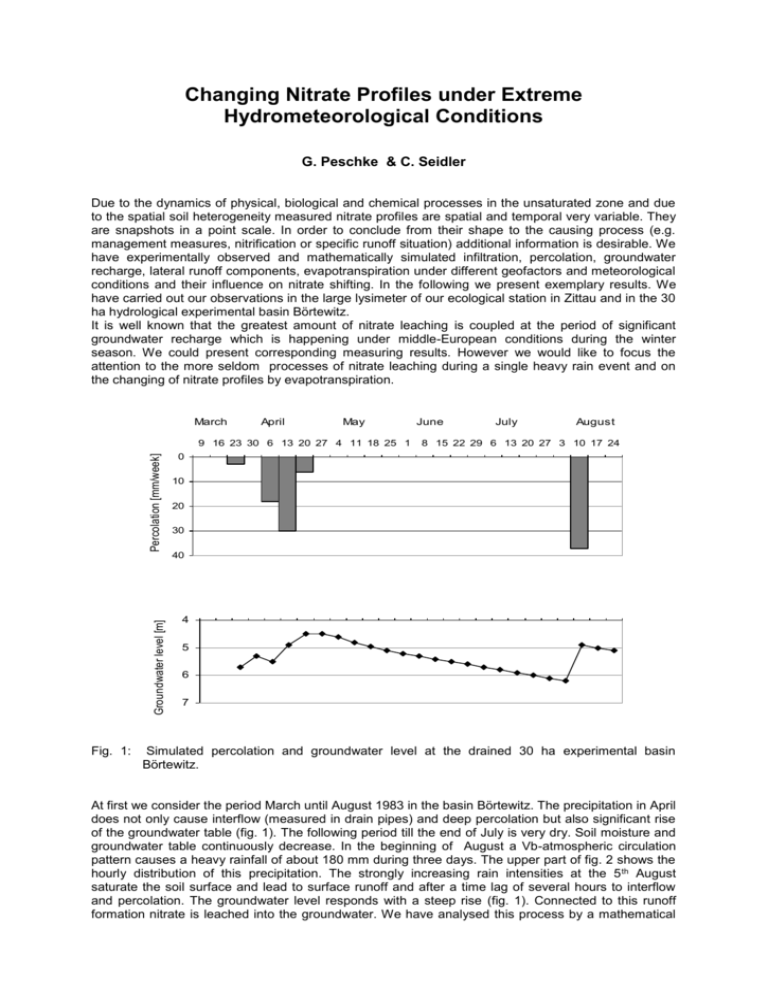
Changing Nitrate Profiles under Extreme Hydrometeorological Conditions G. Peschke & C. Seidler Due to the dynamics of physical, biological and chemical processes in the unsaturated zone and due to the spatial soil heterogeneity measured nitrate profiles are spatial and temporal very variable. They are snapshots in a point scale. In order to conclude from their shape to the causing process (e.g. management measures, nitrification or specific runoff situation) additional information is desirable. We have experimentally observed and mathematically simulated infiltration, percolation, groundwater recharge, lateral runoff components, evapotranspiration under different geofactors and meteorological conditions and their influence on nitrate shifting. In the following we present exemplary results. We have carried out our observations in the large lysimeter of our ecological station in Zittau and in the 30 ha hydrological experimental basin Börtewitz. It is well known that the greatest amount of nitrate leaching is coupled at the period of significant groundwater recharge which is happening under middle-European conditions during the winter season. We could present corresponding measuring results. However we would like to focus the attention to the more seldom processes of nitrate leaching during a single heavy rain event and on the changing of nitrate profiles by evapotranspiration. March April May Percolation [mm/week] 9 16 23 30 6 13 20 27 4 11 18 25 1 June July August 8 15 22 29 6 13 20 27 3 10 17 24 0 10 20 30 Groundwater level [m] 40 Fig. 1: 4 5 6 7 Simulated percolation and groundwater level at the drained 30 ha experimental basin Börtewitz. At first we consider the period March until August 1983 in the basin Börtewitz. The precipitation in April does not only cause interflow (measured in drain pipes) and deep percolation but also significant rise of the groundwater table (fig. 1). The following period till the end of July is very dry. Soil moisture and groundwater table continuously decrease. In the beginning of August a Vb-atmospheric circulation pattern causes a heavy rainfall of about 180 mm during three days. The upper part of fig. 2 shows the hourly distribution of this precipitation. The strongly increasing rain intensities at the 5 th August saturate the soil surface and lead to surface runoff and after a time lag of several hours to interflow and percolation. The groundwater level responds with a steep rise (fig. 1). Connected to this runoff formation nitrate is leached into the groundwater. We have analysed this process by a mathematical model. From the simulation results we chose diurnal nitrate profiles which are presented in the lower part of fig. 2. During the first three days the infiltrating rain increases the soil moisture and the nitrate is only shifted slightly in the upper soil. At the fourth day we can observe a significant nitrate leaching. Altogether more than 80 kg ha-1 NO3 are leached from the upper soil as a consequence of this heavy rain. In addition the simulation provided the results that 6 kg ha -1 NO3 are transported by the drain flow and 23 kg ha-1 NO3 percolate into the groundwater. Further results concerning the soil properties and the observed transport mechanisms (macropore flow and pressure propagation) as well as the used model can be presented in the full paper. 02. Aug 0:00 03. Aug 0:00 04. Aug 0:00 05. Aug 0:00 P [mm] 0 5 10 15 20 kg ha-1 0 10 20 30 40 50 0 10 20 30 40 50 0 10 20 30 40 50 0 10 20 30 40 50 Depth [cm] 20 40 60 80 100 Fig. 2: Hourly amounts of the heavy rain P [mm] event at the beginning of August 1983 (upper part) and simulated Nitrate [kg ha-1] movement (lower part) in Börtewitz Now let us discuss nitrate profiles, measured in March 1999. The monthly precipitation distribution is characterised by a dry period in the middle decade of March. The phenological phase of the rape growing on the lysimeter at this time can be roughly described by a height of 24 cm, a leaf area index of 6,7 and a root depth of 80 cm. The diurnal fluctuations of soil suction in different depth (fig. 3 lower part) confirm the deep rooting. Unusual high amounts of atmospheric evaporation demand (global radiation up to 200 W m-2), a well developed canopy and optimal soil moisture conditions enable diurnal transpiration amounts of 4 mm, which lead to profiles of nitrate and soil moisture showing the high degree of extraction by plant uptake (fig. 3, upper part). NO3 - Concentration [mg l-1] 0 10 20 30 40 50 60 Soil moisture [Vol%] 70 80 30 32 34 36 38 40 42 0 Depth [cm] 20 40 60 3.3.99 12.3.99 23.3.99 26.3.99 29.3.99 80 31.03.99 29.03.99 27.03.99 25.03.99 23.03.99 21.03.99 19.03.99 17.03.99 15.03.99 13.03.99 11.03.99 09.03.99 07.03.99 05.03.99 03.03.99 01.03.99 100 Precipitation [mm] 0 2 4 6 8 10 Soil suction [Pa] 16000 14000 30 cm 12000 50 cm 100 cm 10000 8000 6000 4000 2000 31.03.99 29.03.99 27.03.99 25.03.99 23.03.99 21.03.99 19.03.99 17.03.99 15.03.99 13.03.99 11.03.99 09.03.99 07.03.99 05.03.99 03.03.99 01.03.99 0 Fig. 3: Nitrate withdrawal in the Zittauer Lysimeter during the dry period in March 1999. These examples of simulated and observed nitrate profiles confirm the necessity of additional hydrometeorological, hydrological, soil-physical and plant-physiological information for the interpretation of matter transport by the movement of soil water. This conclusion is of great importance for the more complicated cases of further involved lateral runoff components like Hortonian overland flow, saturation overland flow, further interflow components and groundwater runoff. Those supplemental process studies are presented in the full paper. They provide valuable recommendations for reduced model variants from the complete three-dimensional model.


