Modulation Transfer Function Testing of Optomechanical Systems
advertisement
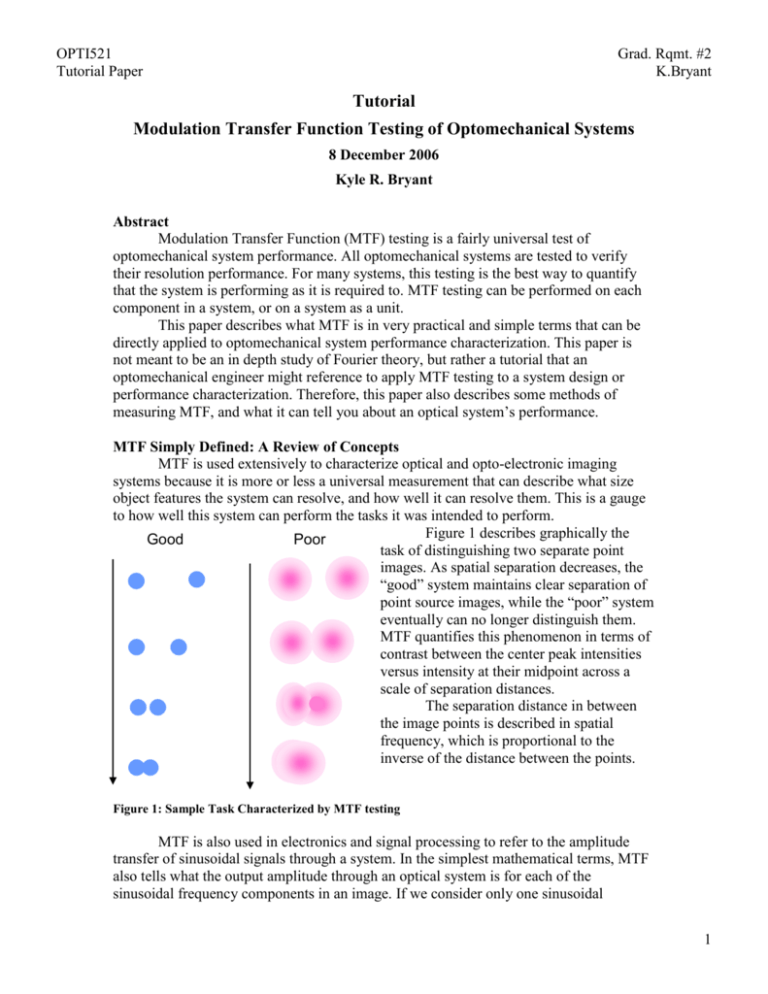
OPTI521 Tutorial Paper Grad. Rqmt. #2 K.Bryant Tutorial Modulation Transfer Function Testing of Optomechanical Systems 8 December 2006 Kyle R. Bryant Abstract Modulation Transfer Function (MTF) testing is a fairly universal test of optomechanical system performance. All optomechanical systems are tested to verify their resolution performance. For many systems, this testing is the best way to quantify that the system is performing as it is required to. MTF testing can be performed on each component in a system, or on a system as a unit. This paper describes what MTF is in very practical and simple terms that can be directly applied to optomechanical system performance characterization. This paper is not meant to be an in depth study of Fourier theory, but rather a tutorial that an optomechanical engineer might reference to apply MTF testing to a system design or performance characterization. Therefore, this paper also describes some methods of measuring MTF, and what it can tell you about an optical system’s performance. MTF Simply Defined: A Review of Concepts MTF is used extensively to characterize optical and opto-electronic imaging systems because it is more or less a universal measurement that can describe what size object features the system can resolve, and how well it can resolve them. This is a gauge to how well this system can perform the tasks it was intended to perform. Figure 1 describes graphically the Good Poor task of distinguishing two separate point images. As spatial separation decreases, the “good” system maintains clear separation of point source images, while the “poor” system eventually can no longer distinguish them. MTF quantifies this phenomenon in terms of contrast between the center peak intensities versus intensity at their midpoint across a scale of separation distances. The separation distance in between the image points is described in spatial frequency, which is proportional to the inverse of the distance between the points. Figure 1: Sample Task Characterized by MTF testing MTF is also used in electronics and signal processing to refer to the amplitude transfer of sinusoidal signals through a system. In the simplest mathematical terms, MTF also tells what the output amplitude through an optical system is for each of the sinusoidal frequency components in an image. If we consider only one sinusoidal 1 OPTI521 Tutorial Paper Grad. Rqmt. #2 K.Bryant frequency that is passed through an optical system; the MTF describes the output amplitude relative to the input amplitude. This is shown in Figure 2. In other simple terms for optics, “Spatial Frequency” typically implies an array of sine or bar targets at a given spacing, expressed in line-pairs-per-millimeter (lp/mm) or cylces -per-milliradian (cy/mrad). An illustration of this is also shown in Figure 2. The contrast at this frequency is compounded with the contrast at all other frequencies to form the MTF. An example of a chart of MTF is also shown in Figure 2. This chart shows the relative transfer through the system of contrast modulation at each spatial frequency, which is why the maximum value is 1. Contrast Modulation is defined simply by averaging the difference of maximum and minimum transmitted intensities 1 Output Signal 0.9 0.8 Imax 14:35:09 0.7 jhimgrint 0.6 0.5 13-Mar-00 0.4 Imin T R T R T R T R DIFFRACTION MTF DIFFRACTION LIMIT 0.0 FIELD ( 0.00 O ) 0.7 FIELD ( -3.49 O) 1.0 FIELD ( -4.79 O) -1.0 FIELD ( 4.79 O ) DEFOCUSING 0.00000 1.0 0.3 WAVELENGTH WEIGHT 11500.0 NM 1 10000.0 NM 1 9000.0 NM 1 8000.0 NM 1 0.9 Original Signal 0.2 0.1 Focal Length 3.94" 0.8 F#/1.64 0.7 0 0 200 400 600 800 1000 Pupil Diameter 2.4" M O 0.6 D U L 0.5 A T I O 0.4 N 0.3 0.2 One line pair 0.1 1.0 8.0 15.0 22.0 29.0 36.0 43.0 50.0 57.0 64.0 71.0 R T SPATIAL FREQUENCY (CYCLES/MM) Figure 2: Sinusoid Contrast at One Spatial Frequency, MTF Chart Example Fourier Theory: Only What you Need to Know There is a great deal of Fourier theory that describes the MTF in mathematical terms. The best practical reference for this may be found in Introduction to Fourier Optics by Goodman. For our immediate purposes, it is best to expedite this explanation to get to what the MTF can tell us about our assembled opto-mechanical system. Optical MTF For the optical portion of an optical system, the point spread function (PSF: shape and amplitude of the image of a point object) will correlate directly to the amplitude of the Fourier Transform of the wavefront in the exit pupil of the system. If this image is of a true point object, it allows us to define the MTF for the system. If we can capture and analyze this image in a decent amount of resolution, we can Fourier Transform this to get MTF. This tells us three very important basics for applying MTF to characterize an optical system: 1.) The MTF contains some wavefront information, which can give us a clue to aberrations, including defocus. 2.) The MTF loses phase information (imaginary values) except that which contributes to the amplitude (real values). The MTF is taken from an image intensity profile, which does not contain phase information. 3.) The MTF is very wavelength dependent because it involves math based on only one wavelength. We typically overcome this by statistically averaging 2 OPTI521 Tutorial Paper Grad. Rqmt. #2 K.Bryant Fourier Transforms and appropriately scaling spatial frequencies in the output. This is how we can measure the point image of a broadband optical system and calculate a corresponding MTF for that system. MTF Results and What They Tell You MTF should be used to verify that a system is performing as it is expected and intended to be performing. Unless aliasing is a big concern, MTF needs only be tested to the Nyquist sampling frequency of the system. Typically, the MTF at the Nyquist frequency is used to report the performance of the optical system. High MTF is good. MTF can tell you most about defocus, field curvature, and the presence of any significant pupil obscurations. MTF charts can be very tricky to interpret in terms of aberration content. The following figures describe a nominal system with induced optomechanical assembly errors. The potential results of MTF tests of the system are shown, and the basic results are annotated in the figure titles. Make note that the MTF changes are very ambiguous. It is quite difficult to determine coma from astigmatism, and it’s even more difficult to interpret what they mean in your optomechanical assembly. The best way to apply MTF to determine errors beyond tolerance allowances is to compare test data with toleranced design MTF data. The differences can give you some clues as to what might be wrong. Let the following example be one that proves to you the MTF is not as useful in error diagnosis as you may think. Consider a lens design that is assembled with two lens cells in a barrel. Group 1 is the triplet farthest from focus, and Group 2 is the triplet nearest focus. Nominal system is shown in Figure ##. It’s a 40-degree FOV, NIR objective lens with a 20-mm focal length. 16:03:25 DIFFRACTION LIMIT DIFFRACTION MTF 12-Dec-06 T R 0.0 FIELD ( 0.00 O ) T R 0.5 FIELD ( 10.00 O ) T R 1.0 FIELD ( 20.00 O ) WAVELENGTH 900.0 NM 880.0 NM 850.0 NM 800.0 NM 760.0 NM 720.0 NM 680.0 NM 640.0 NM 580.0 NM WEIGHT 28 79 100 92 84 71 59 47 29 FIELD POSITION DEFOCUSING 0.00000 16:03:02 1.0 R T 0.00, 1.00 0.000,20.00 DG 0.9 0.8 0.7 M O 0.6 D U L 0.5 A T I O 0.4 N 0.00, 0.48 0.000,10.00 DG 0.3 0.2 0.00, 0.00 0.000,0.000 DG 0.1 6.25 4.00 MM 3.0 6.0 9.0 12.0 15.0 18.0 21.0 24.0 27.0 30.0 .500E-01 MM SPATIAL FREQUENCY (CYCLES/MM) 12-Dec-06 16:04:03 Scale: 15:51:14 DEFOCUSING 0.00000 Figure 3: Example Lens in Nominal State: Very small astigmatism and some coma DIFFRACTION LIMIT DIFFRACTION MTF 12-Dec-06 15:57:40 T R 0.0 FIELD ( 0.00 O ) T R 0.5 FIELD ( 10.00 ) T R 1.0 FIELD ( 20.00 O ) O WAVELENGTH 900.0 NM 880.0 NM 850.0 NM 800.0 NM 760.0 NM 720.0 NM 680.0 NM 640.0 NM 580.0 NM WEIGHT 28 79 100 92 84 71 59 47 29 FIELD POSITION DEFOCUSING 0.00000 1.0 0.00, 1.00 0.000,20.00 DG T R 0.9 0.8 0.7 M O 0.6 D U L 0.5 A T I O 0.4 N 0.00, 0.48 0.000,10.00 DG 0.3 0.2 0.00, 0.00 0.000,0.000 DG 0.1 4.00 MM 12-Dec-06 3.0 6.0 9.0 12.0 15.0 18.0 21.0 24.0 27.0 30.0 .124 MM SPATIAL FREQUENCY (CYCLES/MM) 15:51:19 6.25 Scale: DEFOCUSING 0.00000 Figure 4: Tilt of Group 2 by 1 degree (severe tilt): Lots of Coma 3 OPTI521 Tutorial Paper Grad. Rqmt. #2 K.Bryant 16:14:07 DIFFRACTION LIMIT DIFFRACTION MTF 12-Dec-06 T R 0.0 FIELD ( 0.00 O ) T R 0.5 FIELD ( 10.00 ) T R 1.0 FIELD ( 20.00 O ) O 16:14:21 WAVELENGTH 900.0 NM 880.0 NM 850.0 NM 800.0 NM 760.0 NM 720.0 NM 680.0 NM 640.0 NM 580.0 NM WEIGHT 28 79 100 92 84 71 59 47 29 FIELD POSITION DEFOCUSING 0.00000 1.0 0.00, 1.00 0.000,20.00 DG R T 0.9 0.8 0.7 M O 0.6 D U L 0.5 A T I O 0.4 N 0.00, 0.48 0.000,10.00 DG 0.3 0.2 0.00, 0.00 0.000,0.000 DG 0.1 4.00 MM 12-Dec-06 3.0 6.0 9.0 12.0 15.0 18.0 21.0 24.0 27.0 30.0 .659E-01 MM SPATIAL FREQUENCY (CYCLES/MM) 16:18:40 6.25 Scale: DEFOCUSING 0.00000 Figure 5: Group 2 Decenter 0.1mm: Some Coma and Astigmastism Astigmatism is shown in MTF with a separation in the tangential and radial MTF scans for the same field of view position. But, this is also shown to a lesser extent by coma. Note that the main MTF characteristic that signifies tilt or decenter of optical elements is a separation of tangential and radial curves of the axial MTF. True axial MTF should have no separation. Of course, this could also be due to a misalignment of the test fixturing. This is why a very good characterization and setup procedure should be followed when testing MTF. What Should Accompany MTF Results An optomechanical engineer is not likely to be doing all the MTF testing of their optical systems. Knowing what else should accompany MTF results is important for this engineer to use MTF in proper context. Spectral Data Always get a curve of spectral input along with tested MTF data. This gives you the conditions that the test was run under, and will allow you to compare this with the target spectrum and detector responsivity that you will be using the optomechanical system for. Field of View Data All optical systems have some field of view. It is best to test not only the minimum and maximum fields of view for MTF, but at least one point in between. This is especially true if the optical system has wide field of view, or contains aspheres or significant vignetting. If the MTF is being tested on an optical component, it is also a good idea for the MTF tester to provide “both sides” of the field of view, if nothing more than to verify that the system was aligned properly in the test. If the unit under test in an imaging system with a focal plane, it is important to note focal-plane-tilt that may be diagnosed from positive angle MTF significantly differing from negative side MTF. Focus, F-number, Switchable-Field State For variable focus (i.e. eyepiece diopter setting), variable F-number, and switchable field of view systems, the MTF results should be annotated to include whatever setup condition the lens was in when it was tested. What MTF Does NOT Tell You MTF testing alone does not provide any data on distortion, chromatic aberration, stray light/veiling glare, local image artifacts, or relative illumination by field. Also, it can be very difficult to tell between coma and astigmatism in MTF charts. Other tests 4 OPTI521 Tutorial Paper Grad. Rqmt. #2 K.Bryant must be performed in order to characterize these other performance characteristics. Not all of these may apply to every optical system, but they are important factors in the performance of many systems. Measurement Methods MTF is essentially a measure of the intensity contrast of an optical image per unit of resolution. Intensity is measured in power per unit area, and carries no phase information. Therefore, the MTF measurement methods that follow all rely on capturing the intensity of images that pass through the optical system under test. Bar Target Contrast Definition Measuring MTF by bar target contrast typically incorporates an observer viewing a series of white and black bars through an optical system. The size of the bars and the spaces between them are varied to determine the smallest spatial frequency that is able to be seen. In good tests, the results from several observers are statistically averaged to obtain the performance results. Many different types of bar targets targets can be used in this method. Some targets are more continuous in spatial frequency, like the Siemens star, and some are more discrete, like the 1951 USAF target. Applications When a “user”, or human observer, is meant to view the output of an optomechanical system in order to perform a certain task, bar-target contrast measurement of MTF is an appropriate method. This method inherently takes into account the human eye and brain interaction in characterizing the system performance. This is important to many military systems which involve soldiers viewing optical images to identify targets or navigate terrain. This method really only applies to optical imaging systems that produce visible, viewable imagery for an observer. (Although one may conceive of a method to measure bar target contrast with a detector other than a human observer, this method would surely need to incorporate a “correction factor” for the measurement equipment.) For a system example: a military night-vision system images infrared radiation, and produces visible imagery that a human can see. The infrared imager component is not appropriately tested with a bar target contrast. However, the system as a whole is very appropriately tested in this manner because an observer can see and interpret it. Issues Any human observer interaction in any test makes it subject to error. This is simply because of the variation between observers’ abilities and interpretations. The only real way to validate a bar target contrast test is to use a statistically significant number of observers from a diverse population. Knife Edge Testing Definition This testing method indirectly measures MTF in one dimension by drawing a knife edge across the image plane and recording the intensity of the point spread function in very small steps a high resolution. This method is used accurately for almost any optical component, and applies to all wavebands. 5 OPTI521 Tutorial Paper Grad. Rqmt. #2 K.Bryant The knife edge measurement actually records detector voltage per distance to create a one-dimensional edge response function. This edge response function is the integrated line spread function (LSF: a 1D slice of the PSF). Therefore, the LSF is easily obtained by differentiating the edge response. The 1D MTF is calculated by Fourier transforming the LSF. Differentiate Edge Response Line Spread Figure 6: Knife Edge MTF Testing Applications This test method works very well for broadband imaging optics. Assembled optical lens components are easily tested via this method. Issues The knife edge MTF is only 1D, so one needs to do 2 orthogonal scans at least. This is common. In some occasions, a 2D point spread function lie diagonal to both scan planes, and is measured as either a much smaller or much larger spot than it really is. This is a very common and important error source to note. The knife edge must have access to scan the final image plane. In some cases, diffraction limited relay lenses can aid this. However, in the case of an optical system with a focal plane array in an assembly, knife edge MTF testing will simply not work. Video Capture Definition The development of high resolution and high quality sensors has made video MTF capture a very good way to measure optical components as well as systems. Video MTF requires a very good calibration and knowledge of the measurement system’s MTF. Applications 6 OPTI521 Tutorial Paper Grad. Rqmt. #2 K.Bryant Video MTF allows for real-time focus and alignment of the test piece to the MTF bench, and for application of algorithms that will automatically find the best focus position for the unit under test. These same algorithms can appropriate size the region of interest and make one’s MTF scans much more accurate. Also, the data can be saved with a video capture of the PSF. This method should be used if the magnification of your optical system in the test condition is sufficient to put many recording pixels on the PSF for adequate sampling and low aliasing. In many cases, this rules out very short focal length lenses. Also, this method cannot be easily applied to an imaging system with an integral focal plane array. Issues This method involves a very good characterization of the measurement test station. Also, the focal length of the lens under test cannot be so short as to limit sampling of the focal plane. I have found that this method of MTF testing has proved to be less accurate than the knife edge method. Conclusions MTF is a very good way of verifying that an optical system works as intended to. However, MTF is very ambiguous when used to characterize errors that cause the MTF to deviate from what was expected. One should always verify that an MTF test station is fully characterized and working properly, and that sufficient care is given to alignment of the system under test. 7

