Arsenic and Selenium Transport from Coal Combustion Products
advertisement
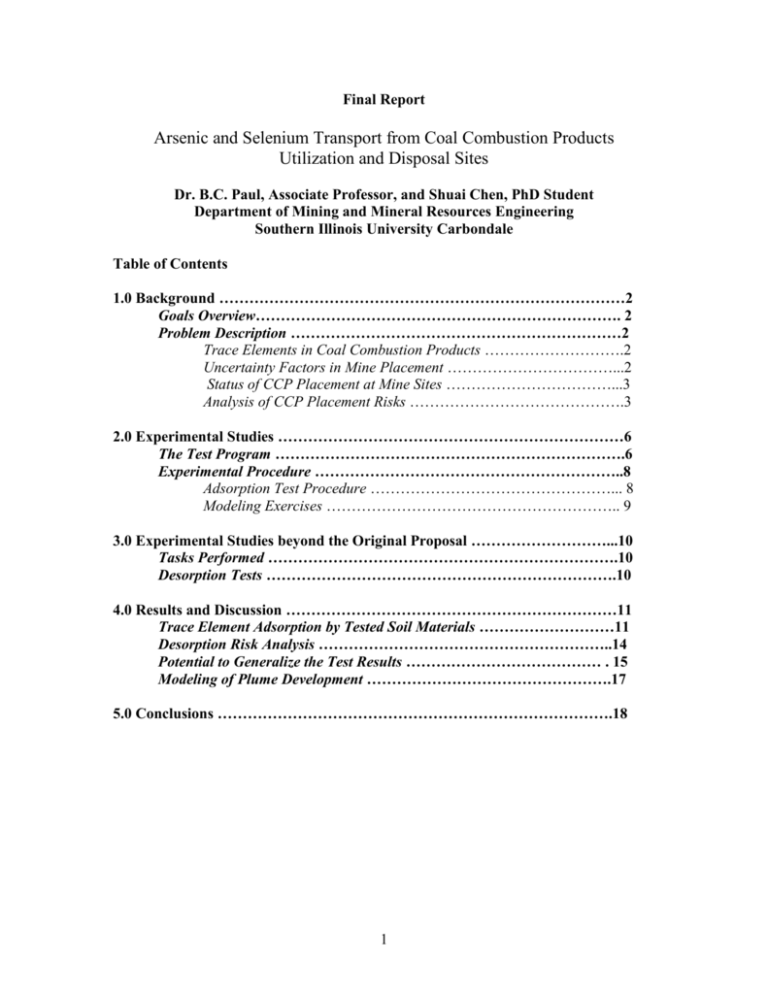
Final Report Arsenic and Selenium Transport from Coal Combustion Products Utilization and Disposal Sites Dr. B.C. Paul, Associate Professor, and Shuai Chen, PhD Student Department of Mining and Mineral Resources Engineering Southern Illinois University Carbondale Table of Contents 1.0 Background ………………………………………………………………………2 Goals Overview………………………………………………………………. 2 Problem Description …………………………………………………………2 Trace Elements in Coal Combustion Products ……………………….2 Uncertainty Factors in Mine Placement ……………………………...2 Status of CCP Placement at Mine Sites ……………………………...3 Analysis of CCP Placement Risks …………………………………….3 2.0 Experimental Studies ……………………………………………………………6 The Test Program …………………………………………………………….6 Experimental Procedure ……………………………………………………..8 Adsorption Test Procedure …………………………………………... 8 Modeling Exercises ………………………………………………….. 9 3.0 Experimental Studies beyond the Original Proposal ………………………...10 Tasks Performed …………………………………………………………….10 Desorption Tests …………………………………………………………….10 4.0 Results and Discussion …………………………………………………………11 Trace Element Adsorption by Tested Soil Materials ………………………11 Desorption Risk Analysis …………………………………………………..14 Potential to Generalize the Test Results ………………………………… . 15 Modeling of Plume Development ………………………………………….17 5.0 Conclusions …………………………………………………………………….18 1 1.0 Background Goals Overview Coal combustion products (CCPs) make suitable fills for use in a variety of settings including as road sub-bases and fills, or as backfills in open pit operations replacing that has been removed. In many instances environmental concerns arise that these materials might leach toxic ultra trace elements such as arsenic and selenium into groundwater supplies with deleterious effects. Many test procedures have been developed to characterize whether various elements may leach from coal combustion products, but site characteristics have been heavily ignored. Specifically, the question of whether elements once leached from coal combustion products would actually remain in solution has not been addressed. Obviously, an element once leached from a CCP would not be a water contaminant if it were not in the water. The objective of this research was to determine whether soils and degraded rocks common to the road cut and mine environments in which CCPs might be placed would allow arsenic and selenium to remain in the water if they did leach. This would provide an environmental risk assessment check that is seldom used in today’s permitting reviews. Problem Description Trace Elements in Coal Combustion Products As and Se are volatile elements that can be liberated from coals in coal burning boilers. As and Se are easily vaporized and rise the gas streams that carry fly ash upward from the boiler. The vapors can be condensed on the surface of fly ash due to the drop of temperature as the flue gas stream progresses. It is widely indicated in the literature on the subject at least a portion of these volatile trace elements forms surface coatings on the fly ash particularly that can in some cases be taken into solution upon contact with water. This situation creates an opportunity for trace elements usually viewed in negative terms to be released into the ground waters should coal combustion products subsequently come in contact with water. Uncertainty Factors in Mine Placement Although USEPA has been examining the regulation of final placement, management, or utilization of CCP since the passage of the Resource Conservation and Recovery Act (RCRA), the issue of mine site placement and utilization remains unresolved to date for a variety of reasons 1) These sites might get saturated by groundwater in the future. Thus current position and contact with the water table may not represent the future water table. 2) As and Se might be leached out (at least in the short term) in concentrations that are over the Federal government’s regulatory limits affecting drinking water. While not all mine site aquifers have ever been suitable sources of drinking water, there are concerns 2 that the groundwater resources of poorer rural populations might be diminished. This then becomes an environmental justice issue. 3) The fly ash in many fill applications is not fully cemented, thus allowing for water movement and percolation that would not be seen in established beneficial use applications such as concrete. This can lead to misgivings amongst the local population or potential liability to companies or users that these residues might lead to plumes and regions of contaminated groundwater. Arsenic and selenium both have the ring of poison to the ears of most listeners. The Status of CCP Placement at Mine Sites EPA has ruled several times that coal combustion products were not RCRA subtitle C hazardous wastes, much to the chagrin of the anti-coal community. First fly ash, bottom ash, and scrubber products were ruled non-hazardous. Then FBC ash materials were ruled non-hazardous. The rulings were then restated in the late 90’s and again in 2000 when the issue of pyrites or other trace wastes being mixed with coal combustion products was brought up. The non-hazardous rulings essentially made CCPs either a RCRA subtitle D waste if disposal was practiced or potentially not a waste at all if a beneficial application was found. These rulings essentially returned control of CCPs to the States which often acted through their primacy programs under the Surface Mining Reclamation and Control Act (SMCRA) to determine how and when CCPs could be placed or utilized at mine sites. Mine site applications frequently attract the glare of anti-coal activists because they involve large amounts of material being used usually in some sort of water or soil conditioning or the filling of mined out voids. While the rationale for such applications differs, many of these uses involve the same kind of loose unlined placement that has historically been seen in unlined open landfills. This leads activists, with some justification, to consider mine site placement nothing more than unregulated disposal. These concerns in turn led USEPA to at least leave open the possibility that it should issue some sort of guidelines or regulations to ensure that mine site placement did not become a simple landfill loop-hole. Of course there is an opposite risk as well. Many large volume CCP applications involve bulk materials fills. If certain types of fill materials ever become classed as too dangerous to place anywhere outside a landfill structure then one gets the opposite of a loophole where in established beneficial uses and recycling are ruled out and expensive and needless land filling is forced upon the society. Analysis of CCP Placement Risks Over time several approaches and philosophies have developed in assessing risk from trace element leaching from CCP sources. One idea is to simply measure pore water concentrations in a fill and compare the concentrations to drinking water limits. If the water in the pores is not drinking water quality the material is considered an environmental hazard. After all, any water that is not drinkable must be contaminated from a drinking water standpoint. Such analysis assumes both the water use and the water quality that would be available. 3 The flaw in this thinking is that essentially stagnant pore waters reach concentrations of elements that would not be found in regularly exchanged water. Most fossil brines are just waters that have been in prolonged un-exchanged contact with the same types of natural rock formations that make up excellent drinking water aquifers. Assuming that a future well would be sited directly in a CCP fill is also a bit of a stretch of pessimism, especially when one realizes that most CCP fills have hydraulic conductivities about two or more orders of magnitude lower than the most of the stratagraphic units at mine sites. Most wells are sited for their ability to produce water, not for their ability to inhibit its extraction. A second level of risk thinking acknowledges that most water used for drinking or other applications is regularly exchanged and has only limited contact time. One way to mimic such conditions is through column leaching where water is allowed or forced to move through the pores of the CCP and then the trace element concentrations are measured in the leachate. Column tests do have some scale effect limitations. As an example, most columns are more uniformly packed than field fill which would allow a great deal of the water to flow through without as much contact. This could produce some over-estimation of concentration. In the end, it is practical limitations that minimize the use of column leaching tests. These tests must run for longer time periods (weeks, months, or perhaps years) with analysis of many water samples. Column tests also can be difficult to interpret. Volatile elements like arsenic and selenium tend to accumulate, at least in part, as surface coatings on CCP. This means that water coming in initial contact with CCPs will potentially leach trace elements at concentrations that could not be sustained. A number of EPA publications refer to the turn “first flush” to describe a water contact with a readily leachable trace element that lacks a supply sufficient to maintain the concentration over any time but the first contact. This investigator’s own experiments have consistently shown for over a decade that trace element concentrations decline drastically after first contact. The principal investigator has suggested a rule of thumb that most trace element concentrations will decline by a factor of 10 or more in the first seven pore volumes of water contact. While the test results have some real meaning and significance in the world, it is difficult to make a decision about whether something is dangerous based on a concentration that drops so quickly. (This is of course a major problem with shake tests that often use water from contact with fresh ash to determine whether the residue exhibits a toxic characteristic in terms of the elements that may leach). Of course column tests, like the pore water volume tests, also suffer from the view that wells will be sited directly in a CCP fill, which, as indicated before, is simply not something that a ground water user would do. Thus assessing risk of CCPs by checking leachate concentrations against water quality standards is a questionable proposition at best. The most popularly used analysis techniques acknowledge that waters contacting CCPs will in fact move through aquifers and that any trace element locally picked up will be diluted and dispersed before entering the system of human and natural uses. This type of 4 thinking has led to two approaches. In the first approach one uses a standardized shake test, often using a leaching medium with some resemblance to a set of conditions believed to be generally realistic of field conditions. The tests use liquid to solid ratios in the 20 to 1 range to limit common ion effects that might inhibit leaching, but the water volume also tends to dilute trace element concentrations from the maximum that could be produced directly in contact with the fill. The 20 to 1 ratio was chosen in part because the dilution would be about right for most of the worst case contamination scenarios in the field. The trace element concentrations in the leachate are then compared to some standard which is usually some multiple of the drinking water limitations and the material is then classed as hazardous or non-hazardous. Of course in designing a test this way, one has tacitly assumed that concentration is mitigated only by dilution and that no active absorption or adsorption processes could be present to remove the element from solution. The flaw in the shake test approach is its obvious disregard for site specifics and its one size fits all flavors. When one desires to incorporate site specifics into the model, it is popular to build a numerical model of groundwater flow and then superimpose on that model contaminant transport characteristics of dilution and dispersion. The models will show where plumes of affected water might go and how bad the effects might or might not be. It is in identification of the flaws of contaminant transport modeling that the contribution of this project comes in. The first flaw of the traditional contaminant transport model is what one uses as a source concentration. The most common entry is a concentration taken from pore water, a column test, or a shake test. The problem is that CCPs by nature have one time surface coatings of volatile trace elements. Concentrations rapidly fall an order of magnitude from initial concentrations. Most modeling is done with an infinite constant source. This assumption is unsustainable with real CCP field placement. The second flaw is that contaminants are assumed to be free to move and disperse with the water once leached that is the entire earth is inert except for the CCP. The reality is that what happens in terms of arsenic or selenium groundwater contamination probably depends more on what happens after the elements are leached from the residues than it depends on whether they are leached from the residues. Dilution and dispersion can greatly reduce concentrations and are often accounted for in contaminant transport computer modeling. Trace elements may also bind to the clays and soils using the same mechanisms that introduced them into the coal millions of years ago. This aspect of contaminant transport and risk assessment is often overlooked and can greatly change the perceived risk of CCP placement in mine sites or in road fills and bases. Obviously the inert earth assumption is wrong and it was with this in mind that USEPA developed a standard approach for adsorption isotherms. The main focus of this project was to develop those standard isotherms that would allow one to predict the adsorption characteristics. The objective of this research was to characterize the capacity of degraded overburden materials at mine sites and soils typical of road cut areas to adsorb arsenic and selenium from groundwater. The information so obtained was to be used to do contaminant 5 transport modeling and characterize the extent of contaminant plume growth and concentration in models that did or did not consider soil adsorption. If soil adsorption proves to have a significant effect it would greatly reduce the risk of groundwater contamination from CCP placement in mine site fill and reclamation and in highway project applications involving loose fills. 2.0 Experimental Studies The Test Program Natural soil or degraded rock materials from around the Midwestern United States were used for the testing in this project. Samples were from degraded overburden rock at mine sites where CCP backfilling was permitted or from sites selected by the Indiana Department of Transportation as appropriate for placement of loose CCP fills and bases. Should loose CCP fills at these sites or type of sites leach, the impacted waters would have to pass through a matrix of the soil and rock materials similar to those that were tested. If the soils and rocks adsorb arsenic and selenium from the water the extent of any contamination plume developing in the field would be reduced. This work tested adsorption of these materials, created adsorption isotherms and then applied the coefficients developed to contaminant transport modeling. Ultimately both adsorption and desorption isotherms were created. The later were intended to access the permanence of any adsorption occurring and the ultimate impact on contaminant plume concentration and size. A computer program developed by Mr. Shuai Chen was used to simulate the As and Se movement in groundwater with the consideration of not only retardation and adsorption but also desorption and pollutant distribution between the soil phase and liquid phase. Several aspects of this type of analysis are not covered in the contaminant transport computer codes popularly in use. The tasks identified in the original project proposal involved the following. Task #1 With consultation from the advisory board select the samples to be studied for their adsorption properties: Status - completed Task #2 Collection of samples chosen by the advisory board: Status - completed Task #3 Sample preparation: Status - completed Task #4 Test concentrations of As and Se: Status- completed Task #5 Running batch tests as depicted in Table 1 below: Status- completed Task #6 Solution sample analysis: Status -completed Task #7 Model running: Status - completed 6 Soil Sandy Acidic Clay “Neutral Clay” Fine-Silty Gravely Soil Well Graded To be Chosen by Advisory Board Table 1 – Batch Test Matrix Character Solution 1 Solution 2 Solution 3 Low As, Se Medium As, High As, Se (50 – 100 Se (200(around 500 ppb ) 300ppb) ppb) Like FBC Like Fresh F Like and leached Type ash recirculating ash pond solutions and high solid: liquid ratios Typical of Minimum Minimum Minimum Riverside 13 tests 13 tests 13 tests Power plants needed needed needed Typical of Minimum Minimum Minimum pyretic 13 tests 13 tests 13 tests underclay needed needed needed and coal refuse Typical of Minimum Minimum Minimum mine 13 tests 13 tests 13 tests underclay needed needed needed Unit Minimum Minimum Minimum Common in 13 tests 13 tests 13 tests Road needed needed needed Construction Unit Minimum Minimum Minimum Common in 13 tests 13 tests 13 tests Road needed needed needed Construction Unit Minimum Minimum Minimum Common in 13 tests 13 tests 13 tests Road needed needed needed Construction Fill in Areas Minimum Minimum Minimum not 13 tests 13 tests 13 tests adequately needed needed needed covered 7 Extra High As, Se (500ppb) desorption Salts may impact exchange capacity and are common in fresh ash Minimum 13 tests needed Minimum 13 tests needed Minimum 13 tests needed Minimum 13 tests needed Minimum 13 tests needed Minimum 13 tests needed Minimum 13 tests needed Experimental Procedure Adsorption Test Procedure This work relies heavily on a standard adsorption testing and isotherm construction method approved by the USEPA. A brief explanation of the test procedure is therefore thought to be in order. Adsorption tests can be conducted in standard shake test apparatus and bottles typical of the TCLP and EPtox tests – i.e. a 30 rpm end over end rotation of a 1 liter bottle containing a test solution and a portion of the solid to be tested. In this case the test solution is distilled deionized water with concentrations of the trace element added to simulate the condition anticipated in contaminated groundwater. The solid is a soil or degraded rock material being tested for its ability to adsorb the trace element in question. Unlike the TCLP which specifies a liquid to solid ratio, the EPA adsorption tests select the ratio based on the first round of tests. In the first round of tests, different liquid to solid ratios are tried for 24 hours of agitation. The objective of this round of testing is to select solid to liquid ratios that will allow clear measurement of the adsorption occurring by common analytical methods such as AA or ICP. If very little adsorption occurs, changes in concentration may be difficult to discern over the variability of the analytical technique itself. The same problem results if almost all of the trace element is adsorbed and the analytical method is forced to trace adsorption near its own detection limit. An ideal liquid to solid ratio would produce about 30% to 70% adsorption of the trace element in question. Two limiting factors became important in the test work done on this project. One limiting factor was that many of the materials tested essentially took all the arsenic and selenium from solution. While the meaning of such a result is clear, from a practical standpoint it essentially eliminates the ability to construct an isotherm. The second and related limiting factor was material size. The USEPA test procedure originally envisioned testing only clays and fine soils and suggested liquid to solid ratios of as high as 500 to 1. In this study, some of the degraded rock was coarser than these fine soils meaning that a high liquid to solid ratios in 1 liter containers might put a significant portion of the test mass in a single grain of material. This will of course be recognized as the type of “nugget effect” problem encountered in one form or another in a great many experiments or analyses. It was found in testing on this project that liquid to solid ratios of 60:1 behaved very consistently and that most 100:1 ratios were ok for the very strong adsorption exhibited by these materials. Ratios beyond this point could not yield reproducible results due to the nugget effect. This non-reproducibility problem was anticipated in advance from simple calculations of the percentage of the total mass that could be contained in one grain of the largest particle size found in the material. Provided that the first round of testing yields a usable liquid to solid ratio, the material then moves to a second phase of shake tests. The objective of this phase was to 8 determine an equilibrium time. It is in fact possible for many types of reactions to remove trace elements from a solution, however, adsorption is considered to be fast and reversible. “Equilibrium” is reached when the rate of removal of the element from solution is equal to the rate of release back into solution. With this in mind the chosen concentration and liquid to solid ratio is tested over different time periods, starting with a few hours at first and eventually increasing in duration. When the concentration change in the solution is less than 5% over a 24 hour period the “equilibrium time” is considered to be found. (One also realizes that if a suitable solid to liquid ratio has not been found, tracing a stable trend to determine when equilibrium is reached would be impossible). The third round of testing places various solid to liquid ratios in contact with the adsorbing material for the equilibrium time. If the equilibrium time happens to be 24 hours, then the first phase of testing becomes the third phase without further experiments. Since 48 hours appeared to be the equilibrium time in most of these tests the serendipitous result of not needing to conduct phase 3 testing did not happen for this project. One type of isotherm that plots the amount of trace element removed from solution against the mass of adsorbing material can be constructed from the phase 3 data. A second type of adsorption isotherm requires that the entire procedure just described be done for at least 4 different trace element concentrations. This suggests the last contrast with the TCLP and probably the reason that adsorption isotherm testing has not achieved the commonality of the TCLP or other similar shake leach tests. This procedure requires hundreds of shake tests in phases to analyze a single material. While the results are harder to achieve than a simple TCLP test, when applied to field risk assessment, they suggest profoundly different conclusions than one might reach from comparing a one time TCLP test to a groundwater standard. Modeling Exercises Computer modeling was used in this study to assess impact of adsorption and source depletion on leachate plume development. The technique used was two-dimensional random walk. In this technique a “typical” field is divided into a square grid. (The size of grid square selected happened to correspond to the dimensions of a “typical” CCP “disposal” or backfilling cell). Leaching trace elements are represented as numeric entities, each entity representing a given mass of the trace element. The rate of water movement is modeled over time steps and each “particle” is moved forward with the flow with dispersion spreading the particles to the side according to dispersivity constants. There is some dispersivity in a forward direction that causes particles to advance forward faster or slower than the water flow. After each time step the number of particles in each grid square is counted and a concentration determined based on mass of the pollutant particles in a grid square versus the amount of water found in the grid square. To ensure reliable results the model was calibrated against a simple case with a known analytical solution. The model was used in several cases. The base case used a constant non-depleting source with only dilution and dispersion mechanisms. This type of modeling tends to be the 9 current standard for assessing plume development potential (even though the “worst case” scenario caveat is usually found somewhere in the report). The next run replaced the constant non-depleting source with a finite source that followed a decay curve and limited the total amount of trace element released to only that available for leaching in the CCP material. Only dilution and dispersion were allowed. The next run retained the depleting source but added adsorption in the form of a “retardation coefficient”. The concept behind a retardation coefficient is that the source will fill all available sites in the adsorbing material and then advance the plume onward. The result in the case of an infinite source is that the same plume develops, but the time required is much greater. (If the source was finite and the soil had the ability to adsorb all of the trace element released in a small area then of course the assumptions in the retardation coefficient model would not be satisfied). The final run explicitly modeled which particles were attached to soils and advanced only those still in solution. It also measured concentration using only particles in the water as opposed to using all particles in the grid. The model was run with a depleting source. Latter model runs also considered the possibility of desorption occurring after the main concentration wave had passed. This model most closely mimics reality, although it did not include fracture flow on a macro scale. 3.0 Experimental Work beyond the Original Proposal Tasks Performed Because this study was used as the basis for a PhD dissertation it was desired to go beyond the work promised in the original proposal. To facilitate work at a high academic level the following additional tasks were performed. Task #1 Desorption batch test: Status- completed Task #2 Desorption isotherm creation: Status -completed Task #3 Model running with the consideration of desorption: Status -completed Desorption Testing Several approaches to “risk analysis” have become common over the years. Adsorption can potentially have very large impacts on development of contaminated groundwater plumes. Obviously, there would be little impact of trace element leaching if the leached element were promptly readsorbed in the surrounding soils. The idea, however, that strong adsorption processes preclude plume development may not always be true either. Adsorption is usually considered to be a reversible process. In fact the notion of an equilibrium point is usually based on the point at which adsorption of ions and desorption of ions is proceeding at the same rate. This leads to concerns that adsorption is only a 10 temporary “fix” to the problem of leaching and that what ever problems were suppressed by adsorption could just as easily reappear at a later date. Depending on the nature of the adsorption it may be necessary to have drastic changes in pH, ion concentration or other factors to reverse an adsorption. Most soil masses have a natural pH and providing enough acidity or alkalinity to overpower and entire regional rock mass would probably be a greater environmental problem than any resulting trace element leaching. To find out how easy the adsorption by these degraded rocks and soils was, this study attempted to reverse the adsorption by dropping the concentration of the trace element in the solution. Such a process could occur in nature if the first flush concentration plume were to pass and low trace element concentrations were to return (assuming that a low trace element state was the natural state). For this reason desorption testing was also performed. The method used for testing was successive dilutions. First the soil material was loaded with the trace element to be tested. Then half of the solution was removed and replaced with distilled deionized water and the shake test was run for 24 hours. Another half of the solution was replaced and so on. Desorption would be indicated by an increase in the concentration over the shake test period. The above desorption results were made available for modeling work. 4.0 Results and Discussion Trace Element Adsorption by Tested Soil Materials Eight different soil and degraded rocks were tested for their adsorption of As and Se with an equilibrium time of 48 hours. Table 2 Samples tested for As and Se adsorption Soil type Sandy Material Road cut sand #3 48 9.4 Sandstone above 7 coal (#4) Silty clay overburden (#1) 48 28.3 0.5 18 Eq. Time As Max. adsorb(ug/g) Se Max. adsorb (ug/g) D50 (mesh) Fine Silty Gravely 48 44.7 Calcareous shale overburden (#5) 48 43.7 Neutral Clay Clay Midwestern road cut (#7) 48 50.6 Silt form Indiana road cut (#6) 48 48 Sand and gravel overburden (#2) 48 29.5 Well Graded Moraine Midwestern road cut (#8) 48 40.3 21.2 25.7 45.6 30.5 7.5 1.4 3.3 87 36.8%>500 100 16.7%>500 28.4%>500 28 235 One of the problems encountered during experimentation was the completeness with which many of the materials adsorbed arsenic and selenium. In order to get isotherms as unaffected by analytical noise as possible it is desirable that the isotherms not depend on the plotting of small concentration changes. Small changes would be a problem if very 11 little of the arsenic or selenium was adsorbed. It would also become a problem if almost the entire arsenic or selenium contents of the water were adsorbed almost immediately. For this reason preliminary tests try to adjust solid to liquid ratios to where about 30% to 70% of the selenium in the water is adsorbed over the equilibrium time. Figures 1 and 2 illustrate that most of the materials tested effectively removed all the arsenic and selenium at the lowest solid to liquid ratios that could maintain representative samples for the size consist and test bottle size. As adsorption by soils at different ratios(500ppb) adsorption percentage 120 1:4 ratio 1:10 ratio 1:20 ratio 1:40 ratio 1:60 ratio 1:100 ratio 100 80 60 40 20 0 1 2 3 4 5 6 7 8 different soils Figure 1 500ppb As stock solution adsorbed by different soils at different soil to solution ratios The As adsorbed by sample 1, 5, 6, 7 and 8 were as high as 90%, with most of them at 100% at any soil to solution ratios. It should be noted that these measurements were made with the highest arsenic concentration tested. Concentrations in this range might be found in the pore waters of a fresh leachate source or in a pond where recirculation and evaporation lead to a build-up of concentration. Obviously, lower arsenic concentrations will tend to show higher adsorption levels, though not necessarily in a linear relationship. Under the highest concentrations tested, percentages of As adsorbed by sample 3 were more affected by soil to solution ratio. This sample adsorbed the least amount of As at any soil to solution ratio among all the samples. Even at 1:40 ratio, it could still remove 50% of the 500 ppb As. Obviously only samples 2 (sand and gravel overburden), 3 (road cut sand), and 4 (sandstone above coal), provided adsorption readings suitable for creation of isotherms. The “failure” of the other materials simply indicates that arsenic is largely and quickly eliminated from water on contact with these materials, which is a highly significant result in itself. It is interesting to note that studies at the Universal Mine in Indiana tend to indicate that arsenic was not moving very effectively. The kind of adsorption seen in these experiments would lead one to anticipate that such a result would be found in the field. 12 Se adsorption by soils at different ratios(500ppb) adsroption percentage 120 100 1:4 ratio 1:10 ratio 1:20 ratio 1:40 ratio 1:60 ratio 1:100 ratio 80 60 40 20 0 1 2 3 4 5 6 7 8 different soils Figure 2 500ppb Se stock solution adsorbed by different soils at different soil to solution ratios The amount of Se adsorbed by these materials was less compared to As adsorbed. Figure 2 is again based on 500 ppb which is the highest selenium concentration tested. Samples 1, 4, 5, 7 adsorbed almost 100% of Se at 1:4, 1:10 and 1:20 soil to solution ratios. Sample 3 adsorbed 27% of Se when the soil to solution ratio reached 1:4. From the figures above, several conclusions seem evident. (1)- Just as clay and soil materials in swamps millions of years ago adsorbed arsenic and selenium into the mineral mater in what was to become coal formations, these same types of materials continue to have this affinity today. The result is that the soils, degraded rocks and clays and mine sites and in road cuts will strongly adsorb arsenic and selenium, inhibiting its ability to form plumes of wide aerial extent even in the event that these elements leach from CCPs in concentrations well above acceptable drinking water limits. (2)- The amount of trace element that can be carried and adsorbed by soils and degraded rocks around mine sites and road cuts vastly exceeds the available arsenic and selenium in CCPs placed in even the largest amounts contemplated for mine site or road cut fills. (3)- The two conclusions above suggest that CCP placement in mine sites or road cuts is unlikely to contaminate groundwater over any significant extent, regardless of whether their leachate concentrations in standard tests exceed drinking water limits by even orders of magnitude. 13 Desorption Risk One of the issues with relying on adsorption processes to prevent plume development is that adsorption is reversible. As discussed previously, drastic pH changes on a field scale are unlikely, but with a depleting source it is highly likely that future trace element concentrations in the water will be much lower than initial concentrations leading to the potential for desorption to occur and boost trace element concentrations in the water. The experiments conducted have been described and several practical outcomes are possible. (1)- Desorption could occur readily and keep concentrations at lower but sustained levels for much longer periods of time. (2)- Desorption might not occur under conditions measurable by the experiment in which case concerns about environmental harm from the temporary nature of adsorption would be eliminated. (3)- Desorption might occur, but the release could be at such low levels that the water would meet environmental standards for drinking and the adsorption process would thus have rendered the release of trace elements from CCPs harmless even though leaching tests indicate violations of drinking water standards. (Of course the use of a drinking water standard for comparison presupposes the water supply in question is of drinking water quality in its native state which is often not the case). None of the eight materials tested showed As desorption after 10 days of desorption testing, which resulted in the maximum hysteresis between adsorption and desorption isotherms. Though four of the eight materials showed Se desorption in 15 days of desorption testing most of the selenium was also held by these soils. Se adsorbed on soils (ug/g) sample 2 and 3 desorption curve 2 1.5 s2 s3 1 0.5 0 0 100 200 Se equilibrium concentration (ppb) Figure 3 Desorption test of sample 2 and 3 14 300 sample 4 and 6 desorption curve 2.6 soil adsorption (ug/g) 2.4 2.2 2 s4 s6 1.8 1.6 1.4 1.2 1 0 5 10 15 20 25 equilibrium concentration (ppb) Figure 4 Desorption test of samples 4 and 6 The above results suggest that desorption will not be an environmental issue. Either desorption will not be triggered in measurable amounts by the depletion of the trace element source, or the release will be at such low levels that arsenic and selenium so released would not harm drinking water. Potential to Generalize the Test Results The materials tested represented a wide range of compositions and size consists. In order to infer more general application of these results than just for the eight materials tested, some of the basic characteristics of the materials were measured. Not surprisingly, since adsorption is a surface process, the strongest relationship is with size consist. The figures below show the size distribution of each of the eight materials and the corresponding adsorption capacity of the materials for arsenic and selenium. Clearly, the adsorption increases with the increasing surface area. 15 soil sample size distribution weight percentage 100 80 +60 mesh 60~325 mesh 325~500 mesh -500 mesh 60 40 20 0 1 2 3 4 5 6 7 8 soil samples Figure 5 size components of the soil samples arsenic adsorption by different soils at 500ppb, 1:100 soil to solution ratio adsorption, ug/g 60 50 40 30 20 10 0 1 2 3 4 5 soil samples Figure 6 As adsorption by different soils 16 6 7 8 selenium adsorption by different soils at 500ppb, 1:40 soil to solution ratio adsorption,ug/g 20 15 10 5 0 1 2 3 4 5 6 7 8 soil samples Figure 7 Se adsorption by different soils A less conspicuous correlation is present for the natural pH of the soil and water medium, but the effect is largely overpowered by the surface area effect. Modeling of Plume Development As a last exercise the computer models were run for simulation. The results shown here portray plume development resulting from a source leaching at up to 10 times the drinking water standard limit and depleting over 80 years. The block diagrams below show the concentrations found in each grid square. The red block represents a source cell of CCP. The water flow is from left to right with hydraulic conductivities typical of mine spoils. The grid size is 100 by 100. The material chosen for the simulation is material #3 which has the weakest adsorption. Obviously suppression by the other materials would be greater. 0 0 0 0 0.1 0.1 0 0 0 0 Figure 8 As distribution in groundwater after 80 years simulation, adsorbed by sample #3 (peak concentration=0.1) The result for a 100 by 100 block of CCP leaching arsenic at 500 parts per billion and depleting over 80 years is that a plume of contamination at 0.1 parts per billion develops directly down gradient for a distance of 100 feet. Rather clearly this could not qualify a broad regional groundwater contamination event. Figure 9 below shows the development of selenium plume under the same conditions. Selenium is not as strongly adsorbed as arsenic. 17 0 0.3 0.3 0.1 0 0 0.2 3.4 22 8.6 0 0 0.1 0.5 0.9 0 0 0 Figure 9 Se distribution in groundwater after 80 years simulation, adsorbed and desorbed by sample #3 (peak concentration=22) In this case the “contamination plume” is 300 feet long and reaches a peak concentration of 22 parts per billion. No part of this plume violates drinking water standards. 5.0 Conclusions The over-all conclusion of this study is that materials commonly found around Midwestern sites where coal combustion products are placed as loose fills will usually adsorb enough As and Se to prevent formation of harmful plumes of any noteworthy areal extent. 18


