Carbon and Nitrogen Isotope analyses by Continuous
advertisement
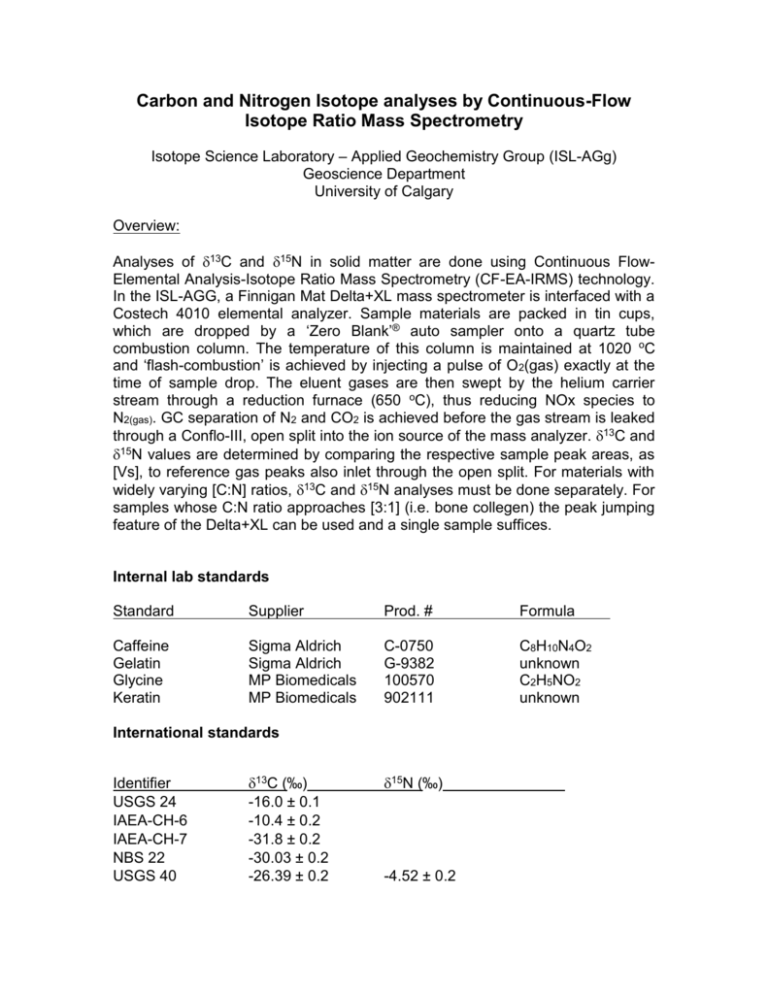
Carbon and Nitrogen Isotope analyses by Continuous-Flow Isotope Ratio Mass Spectrometry Isotope Science Laboratory – Applied Geochemistry Group (ISL-AGg) Geoscience Department University of Calgary Overview: Analyses of 13C and 15N in solid matter are done using Continuous FlowElemental Analysis-Isotope Ratio Mass Spectrometry (CF-EA-IRMS) technology. In the ISL-AGG, a Finnigan Mat Delta+XL mass spectrometer is interfaced with a Costech 4010 elemental analyzer. Sample materials are packed in tin cups, which are dropped by a ‘Zero Blank’® auto sampler onto a quartz tube combustion column. The temperature of this column is maintained at 1020 oC and ‘flash-combustion’ is achieved by injecting a pulse of O2(gas) exactly at the time of sample drop. The eluent gases are then swept by the helium carrier stream through a reduction furnace (650 oC), thus reducing NOx species to N2(gas). GC separation of N2 and CO2 is achieved before the gas stream is leaked through a Conflo-III, open split into the ion source of the mass analyzer. 13C and 15N values are determined by comparing the respective sample peak areas, as [Vs], to reference gas peaks also inlet through the open split. For materials with widely varying [C:N] ratios, 13C and 15N analyses must be done separately. For samples whose C:N ratio approaches [3:1] (i.e. bone collegen) the peak jumping feature of the Delta+XL can be used and a single sample suffices. Internal lab standards Standard Supplier Prod. # Formula Caffeine Gelatin Glycine Keratin Sigma Aldrich Sigma Aldrich MP Biomedicals MP Biomedicals C-0750 G-9382 100570 902111 C8H10N4O2 unknown C2H5NO2 unknown International standards Identifier USGS 24 IAEA-CH-6 IAEA-CH-7 NBS 22 USGS 40 13C (‰) -16.0 ± 0.1 -10.4 ± 0.2 -31.8 ± 0.2 -30.03 ± 0.2 -26.39 ± 0.2 15N (‰) -4.52 ± 0.2 USGS 41 USGS 25 USGS 26 USGS 34 USGS 35 IAEA N1 IAEA N2 IAEA NO3 37.63 ± 0.2 +47.57 ± 0.2 -30.40 ± 0.2 +53.70 ± 0.2 -1.80 ± 0.2 +2.70 ± 0.2 +0.43 ± 0.2 +20.32 ± 0.2 +4.69 ± 0.2 Internal lab standards are used at the beginning, between (every 5th) and the end of each sample tray to correct for instrument drift and to normalize the data to internationally accepted standards Internal lab standards have been characterized against the International Standards listed above and are re-checked periodically USGS LIMs is used for drift correction, normalization and data management. (http://water.usgs.gov/software/LIMS/) Accuracy and Precision: 13Corganic ± 0.2 permil (n=10 internal lab standards) 15Norganic ± 0.2 permil (n=10 internal lab standards) C/N ratio ± 5% References: Preston, T., Owens, N.J.P., 1983. Interfacing an automatic elemental analyzer with an isotope ratio mass-spectrometer – the potential for fully automated total nitrogen and N-15 analysis. Analyst 108, 971–977. R.A. Werner and W.A. Brand, Referencing strategies and techniques in stable isotope ratio analysis, Rapid Communications in Mass Spectrometry, 2001: 15: 501-519 T.B. Coplen et al., New Guidelines for 13C Measurements, Analytical Chemistry, Vol. 78, No. 7, April 1, 2006 U.S. Geological Survey Report 01-4222, Compilation of Minimum and Maximum Isotope Ratios of Selected Elements in Naturally Occurring Terrestrial Materials and Reagents (Revised June 2002)
