Chapter 24
advertisement
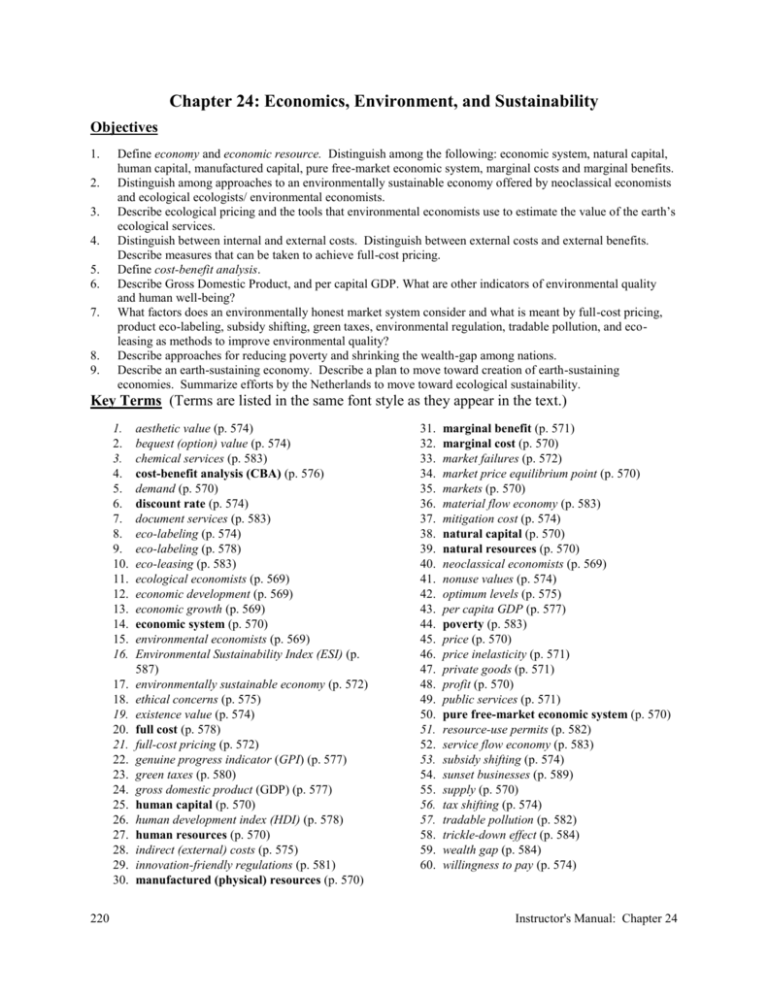
Chapter 24: Economics, Environment, and Sustainability Objectives 1. 2. 3. 4. 5. 6. 7. 8. 9. Define economy and economic resource. Distinguish among the following: economic system, natural capital, human capital, manufactured capital, pure free-market economic system, marginal costs and marginal benefits. Distinguish among approaches to an environmentally sustainable economy offered by neoclassical economists and ecological ecologists/ environmental economists. Describe ecological pricing and the tools that environmental economists use to estimate the value of the earth’s ecological services. Distinguish between internal and external costs. Distinguish between external costs and external benefits. Describe measures that can be taken to achieve full-cost pricing. Define cost-benefit analysis. Describe Gross Domestic Product, and per capital GDP. What are other indicators of environmental quality and human well-being? What factors does an environmentally honest market system consider and what is meant by full-cost pricing, product eco-labeling, subsidy shifting, green taxes, environmental regulation, tradable pollution, and ecoleasing as methods to improve environmental quality? Describe approaches for reducing poverty and shrinking the wealth-gap among nations. Describe an earth-sustaining economy. Describe a plan to move toward creation of earth-sustaining economies. Summarize efforts by the Netherlands to move toward ecological sustainability. Key Terms (Terms are listed in the same font style as they appear in the text.) 1. 2. 3. 4. 5. 6. 7. 8. 9. 10. 11. 12. 13. 14. 15. 16. 17. 18. 19. 20. 21. 22. 23. 24. 25. 26. 27. 28. 29. 30. 220 aesthetic value (p. 574) bequest (option) value (p. 574) chemical services (p. 583) cost-benefit analysis (CBA) (p. 576) demand (p. 570) discount rate (p. 574) document services (p. 583) eco-labeling (p. 574) eco-labeling (p. 578) eco-leasing (p. 583) ecological economists (p. 569) economic development (p. 569) economic growth (p. 569) economic system (p. 570) environmental economists (p. 569) Environmental Sustainability Index (ESI) (p. 587) environmentally sustainable economy (p. 572) ethical concerns (p. 575) existence value (p. 574) full cost (p. 578) full-cost pricing (p. 572) genuine progress indicator (GPI) (p. 577) green taxes (p. 580) gross domestic product (GDP) (p. 577) human capital (p. 570) human development index (HDI) (p. 578) human resources (p. 570) indirect (external) costs (p. 575) innovation-friendly regulations (p. 581) manufactured (physical) resources (p. 570) 31. 32. 33. 34. 35. 36. 37. 38. 39. 40. 41. 42. 43. 44. 45. 46. 47. 48. 49. 50. 51. 52. 53. 54. 55. 56. 57. 58. 59. 60. marginal benefit (p. 571) marginal cost (p. 570) market failures (p. 572) market price equilibrium point (p. 570) markets (p. 570) material flow economy (p. 583) mitigation cost (p. 574) natural capital (p. 570) natural resources (p. 570) neoclassical economists (p. 569) nonuse values (p. 574) optimum levels (p. 575) per capita GDP (p. 577) poverty (p. 583) price (p. 570) price inelasticity (p. 571) private goods (p. 571) profit (p. 570) public services (p. 571) pure free-market economic system (p. 570) resource-use permits (p. 582) service flow economy (p. 583) subsidy shifting (p. 574) sunset businesses (p. 589) supply (p. 570) tax shifting (p. 574) tradable pollution (p. 582) trickle-down effect (p. 584) wealth gap (p. 584) willingness to pay (p. 574) Instructor's Manual: Chapter 24 Outline Economic Systems and Sustainability A. An economic system produces and distributes goods and services by using natural, human, and physical resources. 1. An economic system produces, distributes and consumes goods and services. 2. Three types of resources are used to produce goods and services, natural resources, human resources (labor and skills), and physical or manufactured resources (tools, machinery, etc) B. A purely free-market system is a theoretical ideal where buyers and sellers interact in markets without interference by government or other interference. 1. In the ideal, all economic decisions are governed by demand and supply and price. 2. Curves of supply, demand and price show how surplus occurs, how high demand occurs and where the demand and supply curves intersect, the market price equilibrium point. 3. Profit or loss is the difference between the cost of production and the price buyers are willing to pay. 4. The market price equilibrium shifts when either supply goes down or demand increases, so it may rise or fall depending on the changes that occur in the market. 5. Two related economic concepts are marginal costs, the cost of producing one more unit of a product, and marginal benefits, the profit made by producing and selling one more unit. 6. The marginal benefit is the increase in benefit provided to a buyer when a seller produces one more unit of a product of service. 7. In real world economics, marginal costs and benefits are what actually determine prices and benefits to consumers and costs and profits to producers. 8. In practice, truly free markets do not exist. 9. Businesses try to exert as much control as possible over prices of goods and services, lobby for government subsidies, tax breaks, or regulations that give their product a market advantage. 10. Some consumers will buy a product regardless of its price, economists call this price inelasticity. C. Governments intervene to provide economic stability, national security, public services and environmental protection. 1. Markets often work well in the production of private goods. 2. Providing public services may require that governments intervene to correct market failures and to regulate national security and environmental protection. 3. Government regulation can also prevent development of monopolies or oligolipies where one or a few sellers or buyers dominate the market. 4. Government intervention also helps: a. provide a safety net for people who can’t meet their basic needs b. protect people from fraud, trespass, theft, and bodily harm c. establish and enforce civil rights and property rights d. protect the health and safety of workers and consumers e. prevent or reduce pollution and depletion of natural resources f. manage public land resources D. Ecological economists see economic systems as a component of nature’s economy 1. Neoclassical economics view the earth’s natural capital as a subset or part of a human economic system 2. Ecological economists disagree with this model and its assumptions; rather, they view economic systems as subsystem of the biosphere a. capitalist market systems have several fundament weaknesses b. the models of ecological economists are built on assumptions that resources are limited; sustainable development should be encouraged and unsustainable development discouraged; and harmful environmental and health effects should be included in the market prices of goods and services (fullcost pricing) c. Ecological and environmental economists have suggested several strategies to help make the transition to a more sustainable eco-economy over the next several decades. Valuing Ecological Services and Monitoring Environmental Progress A. Economists have developed several ways to estimate the nonmarket values of the earth’s ecological services. Economics, Environment, and Sustainability 221 B. C. D. E. F. 222 1. Estimate nonuse values such as existence value, based on knowing that an endangered species exists; aesthetic value based on putting a monetary value on the beauty of nature; and a bequest or option value based on the willingness of people to pay to protect some forms of natural capital for future generations. 2. Economists have developed several ways to estimate monetary value of resources. One method is to estimate a mitigation cost, what it would cost to protect, move or restore a natural resource. 3. Another method is to estimate how much people would be willing to pay to keep a particular resource. Economists use discount rates to estimate the future value of a resource. 1. The discount rate is an estimate of a resource’s future economic value compared to present value. 2. Most businesses, the U.S. Office of Management and Budget and the World Bank typically use a 10% annual discount rate. 3. Controversy exists on what the discount rate should be on a resource. Estimating future value or obsolescence is difficult to do. 4. High discount rates encourage rapid use of resources for immediate payoffs. Critics of this means of evaluation feel that a 0% or even a negative discount rate on unique, scarce resources would help to protect them. 5. A moderate discount rate of 1-3% would mean that nonrenewable resources would be used more slowly or sustainably. 6. Some owners of resources use ethical concerns to determine how they use and manage these resources. Market prices for products do not include most of the environmental, health, and other harmful costs associated with its production and use including: 1. Internal costs 2. Indirect costs Environmental economists try to determine optimum levels of pollution and control and resource use. Comparing costs and benefits of an environmental action can help with decision-making, but involves many uncertainties. Cost-benefit analysis (CBA) involves comparing estimated costs and benefits of an action. It is one of the main tools economists use to help them make decisions. 1. CBA evaluates alternative actions for harm or benefit and attempts to assign a monetary value to each factor and component involved. 2. Direct costs are fairly easy to estimate, but indirect costs are often very difficult to estimate and the estimates vary widely. 3. CBA estimates can also be manipulated by parties either supporting actions or opposing actions to be taken. 4. A study by the Economic Policy Institute found that industries almost always overestimated the cost of compliance with proposed environmental regulations. 5. If conducted fairly and accurately, CBA is a useful tool for helping to make economic decisions. 6. Environmentalists and economists advocate using the following guidelines for a CBA: a. use uniform standards b. clearly state all assumptions used c. rate the reliability of data used d. estimate short- and long-term benefits and costs for all affected population groups e. compare the costs and benefits of alternative courses of action f. summarize the range of estimated costs and benefits 7. Economists differ in how they make use of these tools, therefore have differing estimates of costs for resource use or pollution control. 8. In 2003 a joint study by the White House and the Office of Management and Budget (OMB) indicated that the economic benefits of EPA regulations for a 10 year period had economic benefits that exceeded their costs by a factor of 4.5 to 8. We need new indicators to accurately reflect changing levels of environmental quality and human health. 1. Gross domestic product (GDP), and per capita GDP indicators provide standardized and useful method for measuring and comparing the economic outputs of nations. 2. No effort is made to distinguish between goods and services that are environmentally or socially beneficial and those that are harmful. 3. A new approach is to develop indicators that add to the GDP things not counted in the marketplace, but that enhance environmental quality and subtract from GDP the costs of things leading to a lower quality of life and depletion of natural resources. Instructor's Manual: Chapter 24 4. The genuine progress indicator (GPI) was introduced in 1995 to help evaluate and promote sustainability. GPI = benefits not included in market transactions – harmful environmental and social costs. 5. The human development index (HDI) developed by the United Nations Development Program, is based on measurement of a country’ life expectancy, adult literacy, school enrolment, and GDP-PPP per person. Economic Tools for Improving Environmental Quality A. Inclusion of external costs in market prices informs consumers of the cost of their purchases on earth’s lifesupport systems and human health. 1. The full cost of an item would include the actual internal costs plus it actual external costs. 2. Full cost pricing might encourage consumers to conserve water, use fuel efficient cars, produce less trash, because the cost of goods and services would rise dramatically. 3. A gradual transformation to this type of system would allow people to transition and would allow businesses to transition to become more environmentally beneficial. 4. Some reasons that full-cost pricing is not used more widely is that some businesses would be forced out of business, the difficulty in putting a price tag on environmental and health costs. 5. Consumers generally are looking for the best price, so phasing in full-cost pricing requires government action. 6. Governments could begin to move producers and consumers in this direction by phasing our environmentally harmful subsidies, taxing harmful goods and services, regulate pollution and resource depletion. B. Product eco-labeling can encourage companies to develop green products and services and help consumers select environmentally beneficial products and services. C. Removal of environmentally harmful government subsidies and tax breaks will help phase in full-cost pricing. 1. Phase out government subsidies and tax breaks to speed up the use of full-cost pricing. 2. These subsidies cost the world’s governments about $1.9 trillion/year. 3. Businesses receiving these subsidies are opposed to changes, they would level the playing field and promote use of the cheapest and least environmentally harmful energy alternatives. 4. Some countries have already phased out environmentally harmful subsidies. 5. Shifts to full-cost pricing can reduce resource use and pollution and encourage more environmentally sustainable forms of economic growth and development. D. Taxes and fees on pollution and resource use can bring us closer to full-cost pricing. 1. Use green taxes or effluent fees to internalize harmful environmental costs of production and consumption. 2. Charge more for cutting lumber, extracting minerals from public lands, and for using water provided by government-financed projects. 3. Figure 26-9 lists the advantages and disadvantages of using green taxes and fees. 4. Many analysts feel that taxes should be lowered on labor, income and wealth and increased on environmentally harmful activities. 5. Shifting the tax burden to pollution and waste has a number of advantages and many economists have endorsed the concept. 6. Consumption taxes place a larger burden on the poor and lower middle-class than do income taxes, so governments would have to provide safety nets for essentials such as food, fuel, and housing. 7. Nine European countries have begun trial version of this tax shifting, environmental tax reform. E. Environmental laws and regulations work best if they motivate companies to find ways to control and prevent pollution and reduce resource waste. 1. Regulation involves enacting and enforcing laws that set pollution standards, regulate release of toxic wastes and protect irreplaceable resources from unsustainable use. 2. Innovation-friendly regulations can motivate companies to develop eco-friendly products and processes. 3. Some overly costly regulations would discourage innovation. 4. Having slightly less strict standards and somewhat longer time periods for compliance allows companies to develop more innovative ways to prevent pollution and improve resource productivity. 5. Industry and environmental interests can work together to develop realistic standards and timetables. 6. Pollution control regulations must improve environmental quality while not being too costly. Economics, Environment, and Sustainability 223 7. There are a number of problems with the regulatory approach. Cost estimates differ even with experts in the same field. 8. Environmental justice questions also come into play since not everyone may receive the same benefits or be exposed to the same level of harmful emissions. 9. It is difficult to assign monetary values to lost lives, ecosystems, and ecological services. 10. There were several phases to the evolution of environmental management: a) resistance to change from 1970-1985; b) compliance with environmental regulations and reliance on pollution control with little innovation; 1990’s began the innovative management era when managers began to realize environmental improvement could mean an economic and competitive opportunity. This phase is projects to continue over the next 40-50 years. 11. Many corporations now issue environmental and sustainability reports to their stockholders. 12. More than $2 trillion exists in environmentally and socially screened investment funds and has stimulated companies to be more innovative. F. A market-approach to set limits on pollution emissions or resource use is to grant tradable pollution and resource-use permits. 1. A total limit is set for a pollutant or resource to be used and permits are issued or auctioned to manufacturers or users. 2. This approach ahs been used in the U.S. for sulfur dioxide emission reduction. 3. Figure 26-12 lists the advantages and disadvantages of such a system. 4. The effectiveness of such a program depends on the cap level that is set initially and the rate at which the cap is reduced. G. Some businesses can decrease their resource use, pollution, and waste by shifting from selling goods to selling services that good provide. Reducing Poverty to Improve Environmental Quality and Human Well-being A. Most financial benefits of global economic growth have gone to the rich rather than the poor. 1. A World Bank study indicates that 1.1 billion people survive on about $1/day. 2. Poverty has been identified as one of the five major causes of environmental problems. 3. Since 1960, the trickle-down effect has not functioned to help the poor, rather there has been a growing wealth gap. 4. This wealth gap is unsustainable. 5. Poverty is sustained by corruption, absence of property rights, insufficient legal protection, and inability of many people to borrow money to start a small business or grow crops. B. Forgiving the international debts of the poorest countries will sharply cut poverty. Small individual loans to help the poor help themselves will also cut poverty. 1. One way to reduce poverty is to shift more of the national budget to help rural and urban poor work their way out of poverty. 2. Analysts suggest that developed countries forgive at least 60% of the $2.4 trillion debt owed by developing countries on condition that the money be spent on meeting basic human needs. The current situation means that these poor nations will be perpetually poor. 3. In 2005, the heads of the G-8 industrial countries agreed to cancel the debts of 18 f the poorest debtridden countries 4. Developed countries can also increase nonmilitary and private aid to developing countries; mount an effort co combat malnutrition,; encourage lending agencies to make small loans to the poor; invest in small-scale infrastructure projects; mount a global effort to achieve universal education, gender equality and empower women; and help developing countries create more eco-economies. 5. In 2000, the world’s nations set goals for sharply reducing hunger and poverty, improving health care, and moving toward environmental sustainability by 2015. Making the Transition to More Environmentally Sustainable Economies A. An eco-economy copies nature’s four principles of sustainability and environmental economic strategies. 1. Business leader Paul Hawken’s golden rule of eco-economy is: “Leave the world better than you found it, take no more than you need, try not to harm life or the environment, and make amends if you do.” 2. Some businesses will decline as we make the transition to more environmentally sustainable economies and other businesses will grow in importance. B. The Netherlands are working to make their economies more environmentally sustainable. 1. In 1989 the Netherlands began a National Environmental Policy Plan (Green Plan) in response to public alarm over declining environmental quality. 224 Instructor's Manual: Chapter 24 2. Eight major areas for improvement were identified. 3. Task forces were formed for each of these areas consisting of people in industry, government and citizens’ groups; they were charged with developing targets and timetables for drastic reduction of pollution. 4. Four general themes were the focus of each task force: a. life-cycle management b. energy efficiency c. environmentally sustainable technologies d. improving public awareness through a public education program. 5 .Industrial leaders like the Green Plan for several reasons; they have the freedom to deal with problems in ways that make the most sense for their businesses, and it often reduces costs and increases profits for them. 6. Most of the groups have met or exceeded their goals on schedule. 7. There has been an increase in organic agriculture, greater use of bicycles in some cities, more ecologically sound new housing. 8. Some goals have had to be revised or abandoned. 9. the environmental revolution is also an economic revolution. C. Shifting to more environmentally sustainable economies will create immense profits and a huge number of jobs. Economics, Environment, and Sustainability 225
