Topic 2c (foundation) – Homework on Pictograms
advertisement
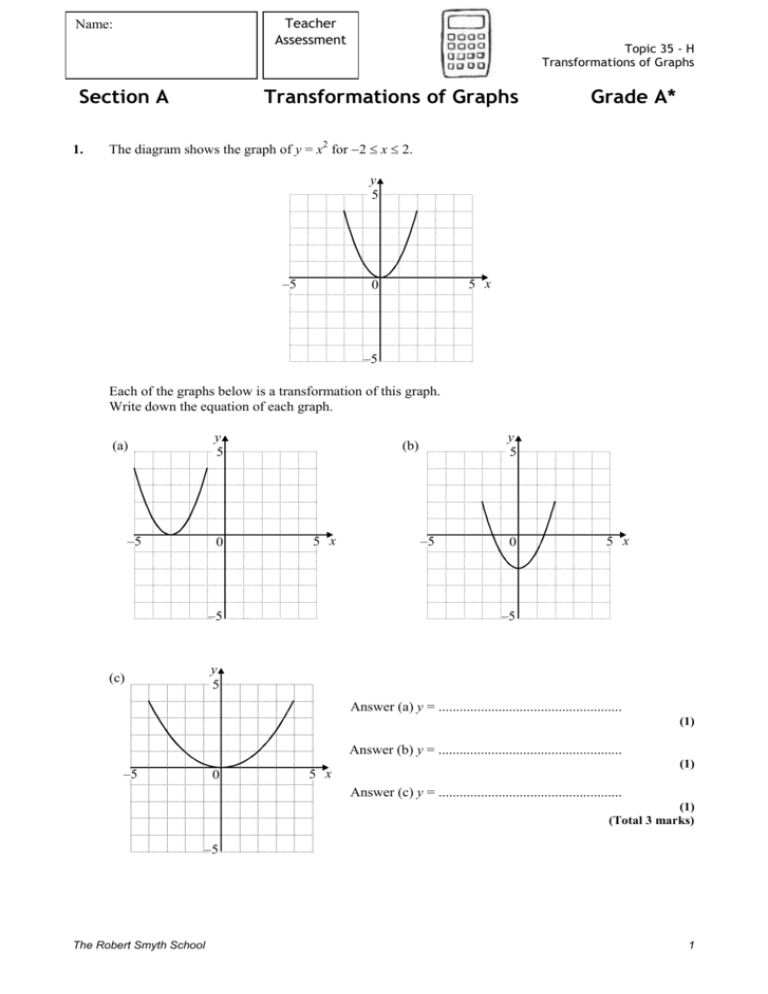
Teacher Assessment Name: Section A 1. Topic 35 - H Transformations of Graphs Transformations of Graphs Grade A* The diagram shows the graph of y = x2 for 2 x 2. y 5 –5 5 x 0 –5 Each of the graphs below is a transformation of this graph. Write down the equation of each graph. y 5 (a) –5 0 y 5 (b) 5 x –5 –5 0 5 x –5 y 5 (c) Answer (a) y = .................................................... (1) Answer (b) y = .................................................... –5 0 (1) 5 x Answer (c) y = .................................................... (1) (Total 3 marks) –5 The Robert Smyth School 1 Topic 35 - H Transformations of Graphs 2. The diagrams, which are not drawn to scale, show the graph of y = x2 and four other graphs A, B, C and D. A, B, C and D represent four different transformations of y = x2. Find the equation of each of the graphs A, B, C and D. y Graph A y = x2 O 3 Answer y Graph B y = x2 –3 x Graph A is y = ......................... O Answer x Graph B is y = ......................... y y y = x2 3 y = x2 O x Graph D O x Graph C Answer Answer Graph D is y = ......................... Graph C is y = ......................... (Total 4 marks) The Robert Smyth School 2 Topic 35 - H Transformations of Graphs 3. The sketch below is of the graph of y = x2 y O x On the axes provided, sketch the following graphs. The graph of y = x2 is shown dotted on each set of axes to act as a guide. (a) y = x2 + 2 y O x (1) The Robert Smyth School 3 Topic 35 - H Transformations of Graphs (b) y = (x – 2)2 y O x (1) (c) 1 y x2 2 y O x (1) (Total 3 marks) The Robert Smyth School 4 Topic 35 - H Transformations of Graphs 4. A(1, 1) and B(–2, 4) are two points on the graph of y = x2 y y = x2 14 12 10 8 6 B(–2, 4) 4 2 A(1, 1) O –2 x 2 –2 Here are three transformations of the graph y = x2. On each diagram the graph of y = x2 is shown dotted. The images A′ and B′ of A and B are shown. Write down the equation of the transformed graph in each case. (a) y 14 12 10 B'(–2, 8) 8 6 A'(1, 5) 4 2 –2 O 2 x –2 y = ........................................ (1) The Robert Smyth School 5 Topic 35 - H Transformations of Graphs (b) y 14 12 10 B'(–2, 8) 8 6 4 2 –2 O A'(1, 2) x 2 –2 y = ........................................ (1) (c) y 14 12 10 8 6 B'(–1, 4) 4 2 A'(2, 1) –2 O 2 x –2 y = ........................................ (1) (Total 3 marks) The Robert Smyth School 6 Topic 35 - H Transformations of Graphs 5. The diagram shows the graph of a function y f ( x). y 5 4 3 2 1 –3 –2 O –1 1 2 3 5 4 6 x –1 –2 –3 –4 –5 On the axes below sketch the graphs of each of these functions. In each case, the graph of y f ( x). is shown to help you. (a) y f ( x) 2 y 5 4 3 2 1 –3 –2 –1 O 1 2 3 4 5 6 x –1 –2 –3 –4 –5 (1) The Robert Smyth School 7 Topic 35 - H Transformations of Graphs (b) y 2 f ( x) y 5 4 3 2 1 –3 –2 O –1 1 2 3 4 5 6 x –1 –2 –3 –4 –5 (1) (c) y f ( 2 x) y 5 4 3 2 1 –3 –2 –1 O 1 2 3 4 5 6 x –1 –2 –3 –4 –5 (1) (Total 3 marks) The Robert Smyth School 8 Topic 35 - H Transformations of Graphs 6. (a) The graph y = x2 is transformed as shown. y y Not drawn accurately y = x2 O (–3,0) O x x Write down the equation of the transformed graph. Answer y = .................................................... (1) (b) The graph of y = 3x – 2 is sketched below. y x O On the same axes, sketch the graph of y = 2 – 3x (2) (Total 3 marks) Success: The Robert Smyth School Target: 9 Topic 35 - H Transformations of Graphs Teacher Assessment Section B Transformations of Trigonometric Graphs Grade A* 1. This is the graph of y = cos x for 0° x 360° y 2 1 0 90 180 270 360 x –1 –2 Write the equation of each of the transformed graphs. In each case the graph of y = cos x is shown dotted to help you. (a) y 2 1 0 90 180 270 360 x –1 –2 Equation y = .............................................................. (1) (b) y 2 1 0 90 180 270 360 x –1 –2 Equation y = .............................................................. (1) (c) The Robert Smyth School 10 Topic 35 - H Transformations of Graphs y 2 1 0 90 180 270 360 x –1 –2 Equation y = .............................................................. (1) (d) y 2 1 0 90 180 270 360 x –1 –2 Equation y = .............................................................. (1) (Total 4 marks) 2. This is the graph of y = sin x for 0° x 360° The Robert Smyth School 11 Topic 35 - H Transformations of Graphs y 3 2 1 0 x 90 180 270 360 –1 –2 –3 Draw the graphs indicated for 0° x 360° In each case the graph of y = sinx is shown to help you. (a) (b) y = – sinx y = 2 sinx (1) (1) y 3 y 3 2 2 1 1 0 x 90 180 270 y = sin 2x (1) 0 x 360 90 –1 –1 –2 –2 –3 (c) 180 270 360 –3 y 3 2 1 0 x 90 180 270 360 –1 –2 (Total 3 marks) –3 The Robert Smyth School 12 Topic 35 - H Transformations of Graphs This is the graph of y = cos x for 0° x 360° 3. y 1 90 O 180 270 360 x –1 (a) On the axes below draw the graph of y = cos(x – 90) for 0° x 360° y 1 90 O 180 270 360 x –1 (2) (b) Write down a possible equation of the following graph. y 1 O 90 180 270 360 x –1 Answer …………………………………………… (1) (Total 3 marks) The Robert Smyth School 13 Topic 35 - H Transformations of Graphs 4. This is the graph of y = sin x. y 1 0 0° 90° 180° 270° 360° x –1 On the grid below, sketch the graph of y = sin (x - 90) y 1 0 0° 90° 180° 270° 360° x –1 (Total 2 marks) 5. The graph of y = sin x for 0° x 360° is shown on the grid below. The point P(90, 1) lies on the curve. y 2 1 O P 90 180 270 360 x –1 –2 On both of the grids that follow, sketch the graph of the transformed function. In both cases write down the coordinates of the transformed point P. The Robert Smyth School 14 Topic 35 - H Transformations of Graphs (a) y = sin (x – 45) y 2 1 O 90 180 270 360 x –1 –2 P (......................., ......................) (2) (b) y = 2sinx y 2 1 O 90 180 270 360 x –1 –2 P (......................., ......................) (2) (Total 4 marks) The Robert Smyth School 15 Topic 35 - H Transformations of Graphs 6. You are given that sin 70° = 0.9397 (a) On the axes below sketch the graph of y = sin 2x for 0° x 360° y 2 1 0 90 180 360 x 270 –1 –2 (2) (b) Hence write down the four solutions of the equation sin 2x = 0.9397 ……………...........……………..……...................…………………………………. ……………...........……………..……...................…………………………………. ……………...........……………..……...................…………………………………. ……………...........……………..……...................…………………………………. Answer ..........................................................degrees .......................................................... degrees .......................................................... degrees .......................................................... degrees (3) (Total 5 marks) Success: The Robert Smyth School Target: 16 Topic 35 - H Transformations of Graphs Teacher Assessment Section C 1. Shapes of Graphs Grade A Match three of these equations with the graphs shown below. y=x+3 y = 3x y = 3x2 y = x2 + 3 y = 3 – x2 y y 3 3 O x Answer y = …………………….. (1) O x Answer y = …………………….. (1) y O x Answer y = …………………….. (1) (Total 3 marks) The Robert Smyth School 17 Topic 35 - H Transformations of Graphs 2. Each of the graphs represents one of the following equations. A y = 3x + 4 B 2x + 3y = 12 C y = x2 – 2 D y = x3 Write down the letter of the equation represented by each graph –2 y y 2 2 1 1 –1 O 1 2 –1 O –2 x –1 –1 –2 –2 Equation ................................ 1 2 x Equation ................................ (1) (1) y 4 2 –4 –2 O 2 4 6 x –2 –4 Equation ................................ (1) (Total 3 marks) The Robert Smyth School 18 Topic 35 - H Transformations of Graphs 3. (a) Four graphs are sketched. y y O x Graph A Graph B y O x O y x x O Graph C Graph D Complete the following statements. y = 2x + 4 matches graph …………………. y = x2 + 4 matches graph …………………. y + 2x = 4 matches graph …………………. (3) (b) Sketch the graph of y = x3 on the axes below. y O x (2) (Total 5 marks) The Robert Smyth School 19 Topic 35 - H Transformations of Graphs 4. Below are three graphs. Match each graph with one of the following equations. Equation A: Equation B: Equation C: Equation D: y = 3x – p y = x2 + p 3x + 4y = p y = px3 In each case p is a positive number. (i) (ii) (iii) y y x Answer y x x Graph (i) Graph (ii) Equation ................................................ Graph (iii) Equation ................................................ Equation ................................................ (Total 3 marks) The Robert Smyth School 20 Topic 35 - H Transformations of Graphs 5. Match each of the sketch graphs to one of these equations. A y = 2 – 2x B y = 2x + 2 C y = 3 – x2 D y = x3 + 4 y 1 E y= 2 x y 2 x x y y 3 4 x x Graph 1 represents equation ……................ Graph 2 represents equation ……................ Graph 3 represents equation ……................ Graph 4 represents equation ……................ (Total 4 marks) 6. The graph shows four curves A, B, C and D. The Robert Smyth School 21 Topic 35 - H Transformations of Graphs y A B C D x Match each curve to its equation. (a) y= 1 is curve .................... x (1) (b) y = 2x is curve ..................... (1) (c) y = 3x is curve ..................... (1) (d) y= 4 is curve .................... x (1) (Total 4 marks) Success: The Robert Smyth School Target: 22
