Experiment 2-8
advertisement

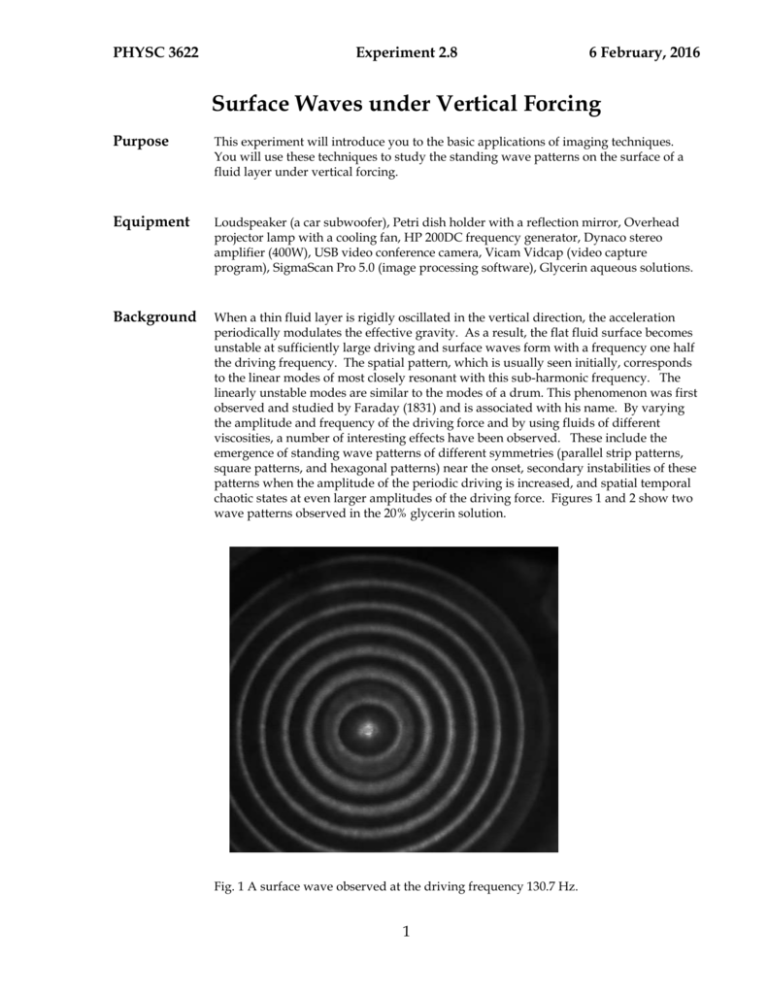
PHYSC 3622 Experiment 2.8 6 February, 2016 Surface Waves under Vertical Forcing Purpose This experiment will introduce you to the basic applications of imaging techniques. You will use these techniques to study the standing wave patterns on the surface of a fluid layer under vertical forcing. Equipment Loudspeaker (a car subwoofer), Petri dish holder with a reflection mirror, Overhead projector lamp with a cooling fan, HP 200DC frequency generator, Dynaco stereo amplifier (400W), USB video conference camera, Vicam Vidcap (video capture program), SigmaScan Pro 5.0 (image processing software), Glycerin aqueous solutions. Background When a thin fluid layer is rigidly oscillated in the vertical direction, the acceleration periodically modulates the effective gravity. As a result, the flat fluid surface becomes unstable at sufficiently large driving and surface waves form with a frequency one half the driving frequency. The spatial pattern, which is usually seen initially, corresponds to the linear modes of most closely resonant with this sub-harmonic frequency. The linearly unstable modes are similar to the modes of a drum. This phenomenon was first observed and studied by Faraday (1831) and is associated with his name. By varying the amplitude and frequency of the driving force and by using fluids of different viscosities, a number of interesting effects have been observed. These include the emergence of standing wave patterns of different symmetries (parallel strip patterns, square patterns, and hexagonal patterns) near the onset, secondary instabilities of these patterns when the amplitude of the periodic driving is increased, and spatial temporal chaotic states at even larger amplitudes of the driving force. Figures 1 and 2 show two wave patterns observed in the 20% glycerin solution. Fig. 1 A surface wave observed at the driving frequency 130.7 Hz. 1 PHYSC 3622 Experiment 2.8 6 February, 2016 Fig. 1 A surface wave pattern observed at the driving frequency 144.9 Hz. References: (1) S. Ciliberto and J. P. Gollub, "Chaotic mode competition in parametrically forced surface waves," J. Fluid Mech. 158, 381 (1985). (2) N. B. Tufillaro, R. Ramshankar, and J. P. Gollub, "Order-Disorder Transition in Capillary Ripples," Phys. Rev. Lett. 62, 422 (1989). (3) P.-L. Chen and J. Vinals, "Pattern Selection in Faraday Waves," Phys. Rev. Lett. 79, 2670 (1997). (4) T. B. Benjamin and F. Ursell, “The stability of the plane free surface of a liquid in vertical periodic motion,” Proc. R. Soc. London A, 225, 505 (1954). Procedure The system is a cylindrical fluid layer about 1 cm deep in a plastic petri dish of inner diameter 8.5 cm. The fluid samples are mixtures of distilled and de-ionized water and glycerin. The concentration of the glycerin solutions varies from 20 to 80 wt.%. A small amount (a few drops) of polystyrene latex spheres of diameter ~0.1 m is added into the solution. These small particles give the solution a milky look, which increases the contrast of the surface waves. The petri dish holder with a reflection mirror is mounted on the cone of a loudspeaker in a way that allows vertical forcing while still permitting light to be transmitted vertically through the petri dish. Precautions should be taken to ensure that the oscillation direction and the cell axis are vertical. A power amplifier and a frequency generator are used to drive the loudspeaker. The control parameters of the experiment are the amplitude (0-200 m) and frequency (0-1000 Hz) of the oscillation. To a good accuracy the motion of the fluid cell is sinusoidal. The surface deformation of the fluid layer is studied by allowing an expanded 2 PHYSC 3622 Experiment 2.8 6 February, 2016 light cone to pass through the fluid layer vertically. The use of an overhead projector lamp provides strong illumination and better contrast. To avoid the heating effect from the light source, the projector lamp should be placed ~60 cm away from the fluid sample. The shadow image of the surface waves is formed on a translucent screen (a tracing paper) located ~7 cm above the fluid sample. A videoconference camera, which is mounted 25-30 cm above the screen, is used to record the image of the surface waves. The camera is connected to a computer through the USB cable. Using the video capture program Vicam Vidcap, one can directly view the surface wave images on the computer monitor. With some minor adjustments, you should be able to get clear pictures of the surface waves. After setting up the apparatus, you may study how the surface wave patterns change with the amplitude and the frequency of the vertical driving. The driving frequency can be easily measured by using an oscilloscope. To measure the oscillation amplitude, you need to attach a mirror to the oscillating frame and get a laser beam reflected from the mirror. The oscillation amplitude can be determined directly from the change of the position of the reflected laser beam using a position-sensitive photodiode (see Ref. 1 for more details). Under a low-amplitude oscillation of frequency f0, the standing wave patterns are well described by the simple linearly unstable modes. In this case, the surface displacement has the following form: Slm (r, , t)=Jl (klm r) sin (l+0) sin (2f0 t/2), where r and are the polar coordinates, t is the time, 0 is an initial phase angle, and Jl is the Bessel function of order l. The wave number klm is determined by the boundary condition that the derivative J’l (klm R)=0. The modes are labeled by the indices (l, m), where l is the number of angular maxima and m-1 (or m if l=0) is the number of nodal circles (see Ref. 4 for more details). Before going to more complicated non-linear wave patterns, you may first try to find a linear mode. Using the SigmaScan Pro 5.0 program, you can get an intensity profile of the circular standing wave along the cell diameter. An azimuthal average of the intensity profile improves the statistics of the final intensity profile over varying positions. This intensity profile should be compared with the equation discussed above. For other standing wave patterns, you may plot their phase diagram as a function of the driving amplitude A and frequency f 0 (see Refs. 1 and 3 for more details). These wave patterns remain certain symmetry in a given range of A and f 0. Another interesting effect you may study is to see how the fluid viscosity and cell size affect the wave pattern. The fluid viscosity can be changed using the glycerin solutions with different concentrations. To change the cell size, you need to make a new petri dish adapter so that a smaller petri dish can be mounted on the oscillation frame. Questions Because the parameter space of this experiment is very large, you may want to vary only a few parameters and keep the other parameters fixed. In you project report, you need to discuss how these parameters are chosen and compare your results with the previous results in the literature. 3


