Psychology 120 - Fredericton High School
advertisement
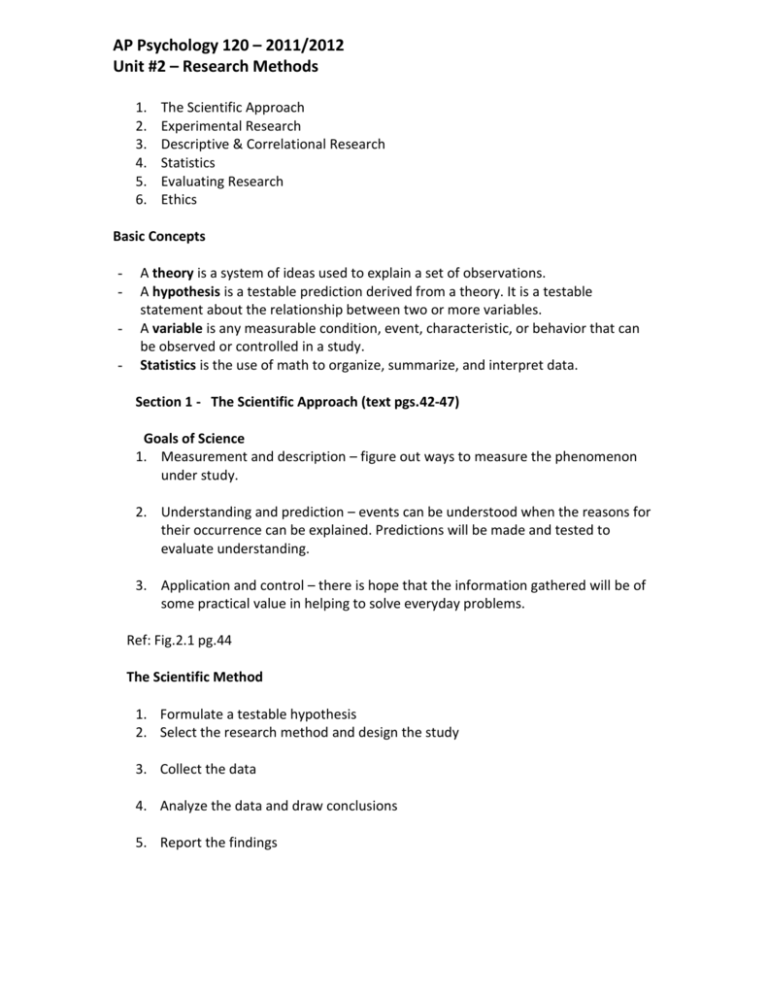
AP Psychology 120 – 2011/2012 Unit #2 – Research Methods 1. 2. 3. 4. 5. 6. The Scientific Approach Experimental Research Descriptive & Correlational Research Statistics Evaluating Research Ethics Basic Concepts - A theory is a system of ideas used to explain a set of observations. A hypothesis is a testable prediction derived from a theory. It is a testable statement about the relationship between two or more variables. A variable is any measurable condition, event, characteristic, or behavior that can be observed or controlled in a study. Statistics is the use of math to organize, summarize, and interpret data. Section 1 - The Scientific Approach (text pgs.42-47) Goals of Science 1. Measurement and description – figure out ways to measure the phenomenon under study. 2. Understanding and prediction – events can be understood when the reasons for their occurrence can be explained. Predictions will be made and tested to evaluate understanding. 3. Application and control – there is hope that the information gathered will be of some practical value in helping to solve everyday problems. Ref: Fig.2.1 pg.44 The Scientific Method 1. Formulate a testable hypothesis 2. Select the research method and design the study 3. Collect the data 4. Analyze the data and draw conclusions 5. Report the findings Ref: Tab. 2.1 pg. 45 – Key data collection techniques in Psychology – direct observation, questionnaire, interview, psychological test, physiological recording, examination of archival records Advantages of the Scientific Method 1. Clarity and precision – avoids logic, casual observation, and common sense. 2. Intolerance of error – scientists are trained to be critical thinkers. Section 2 - Experimental Research (text pgs.48-51) - - - - - - An experiment is a research method in which the researcher manipulates a variable (independent variable) under carefully controlled conditions and observes whether any changes occur in a second variable (dependent variable) as a result. This is a relatively powerful procedure that allows researchers to detect cause-andeffect relationships. For example, a researcher wants to examine the effects of stress on performance. The researcher can design an experiment which controls the level of stress the participants experience while performing a task. In this example, the level of stress is the independent variable and the quality of performance is the dependent variable. An independent variable is a condition or event that the experimenter varies in order to see its impact on another variable. A dependent variable is the variable that is thought to be affected by manipulation of the independent variable. In running an experiment, the researcher will give the experimental group of participant’s special treatment with the independent variable. The control group of participants does not receive this treatment. This way the two groups are all alike except with regard to the independent variable, thus allowing the researcher to measure the impact of the independent variable on the dependent variable. For example, a researcher believes a new drug may be useful for treating depression. Participants diagnosed with depression are then randomly assigned to either the experimental group or the control group. The experimental group receives the drug treatment, while the control group receives a placebo (a “drug” with no active ingredient). The two groups are then the same except for the use of the active drug, thus the researcher can isolate the effect of the drug (independent variable) on the depression (dependent variable). Extraneous variables are those variables other than the independent variable which can affect the dependent variable. An extraneous variable can confound a study (two variables are linked together in a way that makes it difficult to sort out their specific effects). To control for this, researchers randomly select subjects into the control and experiment groups. For example, to ensure gender wasn’t a confounding variable in a study, a researcher would randomly assign men and women to the experiment and control groups. Variations in Experimental Design 1. Subjects can sometimes serve as their own control group. For example, to study the effect of noise on concentration, a researcher may give a group of participants a set of math problems to solve. Then the same people may be given another set of problems to solve while listening to loud noise. In this example, the subjects first are the control group (no special treatment) and then become the experiment group (receiving the special treatment). 2. More than one independent variable may be manipulated during an experiment. For example, besides studying the effect of noise on concentration, the researchers could also study the effects of different types of music or of lighting or room temperature on concentration. 3. More than one dependent variable may be studied during an experiment. For example, the speed and accuracy of the problem solving could be observed. Ref: Fig. 2.2 pg.51 Advantages and Disadvantages of Experimental Research - - This is the only research method which allows researchers to draw causal (cause and effect) conclusions about how one variable affects another. Experiments are often artificial. For example, a researcher who wants to examine decision making in juries could get twelve participants to make a decision on a case, but could never completely replicate a real jury preparing a real verdict for a real trial. Some things can’t be studied through an experiment. For example, to demonstrate a casual relationship between smoking and cancer, a researcher would have to have a control group which didn’t smoke and an experiment group that would smoke. Section 3 – Descriptive & Correlational Research (text pgs. 52-57) Descriptive & Correlational Approaches - Sometimes psychologists cannot exert experimental control over the variables they want to study for either ethical or practical reasons. Investigators must rely on descriptive/correlational research methods. - Naturalistic observation allows a researcher to observe behavior in its natural setting. The researcher does not control or interfere with the subjects. - Case studies are in depth investigations of individual subjects. This is useful for rare events or conditions. - Surveys employ interview or questionnaires to gather information about specific aspects of subjects’ behavior. This allows researchers to study large groups of people. - All of these approaches allow researchers to study subjects outside a laboratory setting. Researchers cannot manipulate the variables under study. This lack of control means that these methods cannot be used to demonstrate cause-and-effect relationships. - These methods permit investigators to only describe patterns of behavior and discover links or associations between variables. Ref. Fig.2.4 pg.56 Section 4 – Statistics and Research (text pgs.57-61) Statistics is the use of mathematics to organize, summarize and interpret numerical data. Statistical analyses permit researchers to draw conclusions based on their observations. Two basic types of statistics: A. Descriptive statistics – are used to organize and summarize data. Key descriptive statistics include – measures of central tendency, measures of variability, and the coefficient of correlation. 1. Central tendency – In summarizing numerical data, researchers often want to know what constitutes a typical or average score. To answer this question they use three measures of central tendency – the median, the mean, and the mode. Median – is the score that falls exactly in the center of a distribution score. Half the scores fall above the median and half fall below it. Mean – is the arithmetic average of the scores in a distribution. It is obtained by adding up all the scores and dividing by the total number of scores. Mode – is the most frequent score in the distribution. 2. Variability - refers to how much the scores in the data set vary from each other and from the mean. The standard deviation is an index of the amount of variability in a set of data. When variability is great, the standard deviation will be relatively large. When variability is low, the standard deviation will be smaller. 3. Correlation – a correlation exists when two variables are related to each other. For example – investigators often want to quantify the strength of an association between two variables, such as between class attendance and course grades. To do this they rely on – the correlation coefficient – is a numerical index of the degree of relationship between two variables. A correlation coefficient indicates: The direction (positive or negative) Positive vs. negative correlation: A positive correlation (+) indicates that two variables co-vary in the same direction – high scores on variable x are associated with high scores on variable y. A negative correlation (-) indicates that two variables co-vary in the opposite direction – people with high scores on x tend to score low on y, whereas those who score low on x, tend to score high on y. How strongly the two variables are related Strength of correlation: The size of the coefficient indicates the strength of an association between two variables. The coefficient can vary between 0 and +1.00 (if positive) and between 0 and -1.00 (if negative). A coefficient near zero indicates no relationship between the variables. A coefficient of +1.00 or -1.00 indicates a perfect, one to one correspondence between the two variables. Most correlations fall between these extremes. The closer the correlation to either -1.00 or +1.00, the stronger the relationship. Correlation and prediction – a close link exists between the magnitude of a correlation and the power it gives scientists to make predictions. Correlation and causation – although a high correlation allows us to predict one variable from another, it does not tell us whether a cause-and-effect relationship exists between the two variables. B. Inferential statistics After researchers have summarized their data with descriptive statistics, they still need to decide whether their data support their hypotheses. Inferential statistics are used to interpret data and draw conclusions. - Working with the laws of probability, researchers use inferential statistics to evaluate the possibility that their results might be due to the fluctuations of chance. - When statistical calculations indicate that research results are not likely due to chance, the results are said to be statistically significant. Statistical significance is said to exist when the probability that the observed findings are due to chance is very low. Here, significant does not mean – important or even interesting – they simply are research results that are unlikely to be due to chance. Ref: Fig.2.5 pg.58, Fig. 2.6 pg.58, Fig.2.7 pg.59, 2.8 pg. 59, Fig. 2.9 pg.60 Section 5 – Evaluating Research (text pgs.62-65) Evaluating research – Even though scientific research is a more reliable source of information than casual observation or popular belief, it would be wrong to conclude that all published research is free of errors. - Replication is the repetition of a study to see whether the earlier results can be duplicated. Studies are replicated many times before the findings are generally accepted. - A meta-analysis combines the statistical results of many studies into one set of data. Flaws in research - Sampling bias occurs when a sample (the collection of subjects selected for observation in an empirical study) is not representative of the population from which it is drawn. - A placebo is a substance that resembles a drug but has no actual pharmacological effect. In studies that assess the effectiveness of medications, placebos are given to some subjects to control for the effects of a treacherous extraneous variable – participants expectations. The placebo effect occurs when participants’ expectations lead them to experience change even though there is no special treatment. - Distortions in self-report data - Often people respond to research questions with the social desirability bias, in which they give answers which are socially desirable rather than accurate. - Often people respond to questions in a particular way that is unrelated to the content of the questions – for example agree with everything on a questionnaire. This is called response set. - Experimenter bias occurs when a researcher’s expectations or preferences about the outcome of a study influence the results obtained. This is controlled by the double-blind procedure, in which neither subjects nor experimenters know which subjects are in the experiment group and which are in the control group. Ref: Fig. 2.10 pg. 62 Section 6 – Research Ethics (text 65-68) Deception - Deception of participants has become common in psychological research since the 1960’s. - Some researchers oppose the use of deception because it involves lying to subjects, potentially undermining the subjects’ trust in the experimenters, and may make the subjects feel bad when the deception is revealed. - Most researchers support the use of deception because some issues cannot be studied without deception. There is no evidence that deception is inherently harmful to participants, and the benefits of deception outweigh the costs. Animal Research - Psychologists use animals for research because they want to learn about the animal behavior, or to compare the animal behavior to human behavior, or because certain treatments are unethical to be done on humans. - Some researchers believe that it is wrong to subject animals to any harm for research purposes and that the results may not be applicable to humans. - Most researchers support the use of animal research because of the advancement of science for treatment of human disorders. APA (American Psychological association) Ethical Guidelines for Research 1. A subject’s participation must be based on informed consent. 2. Participants should not be exposed to harmful or dangerous procedures. 3. If an investigation requires some deception of participants, the researcher is required to explain and correct any misunderstandings as soon as possible. 4. A subject’s right to privacy should never be violated. 5. Harmful or painful procedures imposed on animals must be thoroughly justified in terms of the knowledge to be gained from the study. Prior to conducting studies, approval should be obtained from the host institution (usually a university) and research review committee (usually made up of other psychologists). Canadian Psychological Association (CPA) – Key Principles in Psychological Research designed to ensure the welfare of both human and animal participants Principle 1 – Respect for the dignity of persons Principle 2 – Responsible caring Principle 3 – Integrity in relationships Principle 4 – Responsibility to society
