3. Graphical Analysis: Motion (S)
advertisement
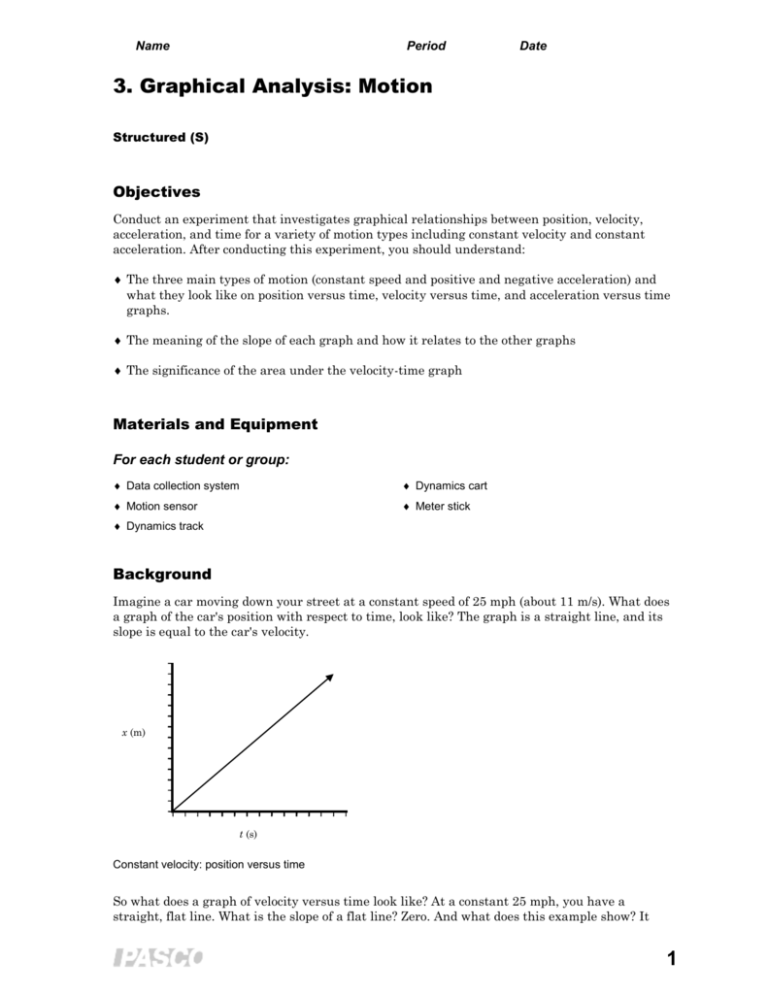
Name Period Date 3. Graphical Analysis: Motion Structured (S) Objectives Conduct an experiment that investigates graphical relationships between position, velocity, acceleration, and time for a variety of motion types including constant velocity and constant acceleration. After conducting this experiment, you should understand: The three main types of motion (constant speed and positive and negative acceleration) and what they look like on position versus time, velocity versus time, and acceleration versus time graphs. The meaning of the slope of each graph and how it relates to the other graphs The significance of the area under the velocity-time graph Materials and Equipment For each student or group: Data collection system Dynamics cart Motion sensor Meter stick Dynamics track Background Imagine a car moving down your street at a constant speed of 25 mph (about 11 m/s). What does a graph of the car's position with respect to time, look like? The graph is a straight line, and its slope is equal to the car's velocity. x (m) t (s) Constant velocity: position versus time So what does a graph of velocity versus time look like? At a constant 25 mph, you have a straight, flat line. What is the slope of a flat line? Zero. And what does this example show? It 1 Graphical Analysis: Motion shows that since your velocity is not changing, you are not accelerating, which indicates that the slope of a velocity versus time graph is equal to acceleration. v (m/s2) t (s) Constant velocity versus time If the same car accelerates from rest at a constant rate, the position versus time graph is no longer a straight line. The graph curves upward like a parabola because the car is covering a greater distance each second. x (m) t (s) Accelerating velocity: position versus time Using the slope of the position versus time graph to determine the car's velocity we get: v (m/s) t (s) Accelerating velocity versus time 2 PS-2899A Student Worksheet (S) Constant acceleration means that the car's velocity is increasing at a constant rate which we can see in the velocity versus time graph as a straight line with a non-zero slope. The slope of the velocity versus time graph shows how quickly the car accelerates (a steeper slope means greater acceleration). Finally, the acceleration versus time graph is a straight flat line whose constant value is equal to the slope of the accelerating velocity versus time graph. a (m/s2) t (s) Acceleration versus time Relevant Equations velocity displacement time acceleration v t (1) (2) Safety Follow all standard laboratory procedures. Procedure After you complete a step (or answer a question), place a check mark in the box () next to that step. Note: When you see the symbol "�" with a superscripted number following a step, refer to the numbered Tech Tips listed in the Tech Tips appendix that corresponds to your PASCO data collection system. There you will find detailed technical instructions for performing that step. Your teacher will provide you with a copy of the instructions for these operations. Set Up 1. Place the dynamics track on the lab table and set the cart in the center of the track. 3 Graphical Analysis: Motion 2. Adjust the level of the track by raising or lowering the track feet until the cart sits stationary in the center of the track without rolling. 3. Mount the motion sensor to one end of the dynamics track with the face of the sensor pointing down the length of the track. Note: Ensure the switch on the top of the sensor is set to the cart icon. 4. Connect the motion sensor to the data collection system. �(2.1) 5. Display two graphs simultaneously. �(7.1.11) On one graph display Position on the y-axis and Time on the x-axis. On the second graph, display Velocity on the y-axis and Time on the x-axis. �(7.1.1) 6. Test the motion sensor by recording a short run of data while moving your hand towards and away from the front of the sensor. �(6.2) Do the graphs show that the sensor detected your hand's motion? Is the data consistent with the motion of your hand? If so, continue to the next step. If not, readjust the motion sensor so it reads properly. Contact your teacher for further help if necessary. Part 1 – Constant Velocity Collect Data 7. Place the cart stationary on the track about 0.20 m from the sensor. 8. Begin data recording. �(6.2) You should hear the clicking sound of the signal sent out by the sensor. Adjust the scale of the graphs to show all data. �(7.1.2) 9. Gently push the cart with your hand so that it glides smoothly away from the sensor. Stop the cart before it leaves the track. 10. Stop data recording. �(6.2) . Note: On your position versus time graph, you should see a flat line briefly before you pushed the cart, then a smooth sloped line showing the cart's increasing position as time passes. Finally, you should see the sloped line abruptly become horizontal at the point where the cart stops. If these trends are not present, or do not make sense to you, repeat the previous steps until your data is more representative of the motion of constant velocity. Part 2 – Constant Acceleration Collect Data 11. Put a textbook beneath the track near the motion sensor so the cart will accelerate down the hill (away from the sensor) when released. 4 PS-2899A Student Worksheet (S) 12. Hold the cart stationary at the top of the track about 0.20 m from the sensor. 13. Begin data recording �(6.2) and release the cart, catching it at the bottom of the ramp. 14. When the cart reaches the bottom of the ramp, stop data recording. �(6.2) Part 3 – Constant Negative Acceleration Collect Data 15. Move the textbook to the other end of the track so the motion sensor is at the bottom of the incline. 16. Hold the cart stationary at the bottom of the track about 0.20 m from the sensor. 17. Begin data recording �(6.2) and gently push the cart uphill (away from the sensor), letting it decelerate to the top of its path. Keep recording as the cart descends, but do not let the cart leave the track at the top of the hill, or come back and hit the sensor at the bottom (catch the cart at the bottom of the track). 18. Stop data recording. �(6.2) Data Analysis 1. Explain the meaning of the slope from both the Position versus Time and Velocity versus Time graphs and how slope helps determine the instantaneous acceleration at any time of any graph. _________________________________________________________________________________________ _________________________________________________________________________________________ 2. Without looking at the Acceleration versus Time graphs on your data collection device, sketch the acceleration versus time graphs for each type of motion from their corresponding velocity versus time graphs. Be sure to label the axes correctly. 5 Graphical Analysis: Motion Analysis Questions 1. One of the three types of motion we explored was constant velocity, but was the velocity of the cart totally constant during your trials, or did it slow slightly? What are some factors that may have caused the velocity of the cart to not be constant? ________________________________________________________________________________________ ________________________________________________________________________________________ 2. Another type of motion we explored was constant acceleration. What caused the constant acceleration of the cart? How could you have increased this acceleration, and how would your graphs of position and velocity versus time be different if the acceleration was greater? ________________________________________________________________________________________ ________________________________________________________________________________________ 3. Imagine you were standing in front of a motion sensor which was measuring your position as a function of time as you moved towards and/or away from the sensor. If the graph below shows this data, describe your motion during data collection in terms of your speed and direction. ________________________________________________________________________________________ ________________________________________________________________________________________ ________________________________________________________________________________________ 6 PS-2899A Student Worksheet (S) Synthesis Questions Use available resources to help you answer the following questions. 1. For each of the two position versus time graphs below, sketch the corresponding velocity (i) and acceleration (ii) versus time graphs in the blank axes below the graph. a) i) ii) b) 7 Graphical Analysis: Motion i) ii) 2. Given the velocity versus time graph shown below, draw the corresponding position versus time (i) and acceleration versus time (ii) graphs. (Assume the object starts at x = 0 meters at time t = 0) i) ii) 8 PS-2899A Student Worksheet (S) 3. Given the acceleration versus time graph shown below, draw the corresponding position versus time (i) and velocity versus time (ii) graphs. Assume that initial velocity at t = 0 equals 0 m/s. i) ii) Multiple Choice Questions Select the best answer or completion to each of the questions or incomplete statements below. 1. Which of the following statements about a velocity versus time graph is true? A. Its slope will be constant and non-zero if the object moves at constant speed. B. The area under the graph always gives the position of the object from the origin. C. The slope will be negative where the object is decelerating. D. The slope will be curved upward if the object undergoes constant acceleration. E. The slope will be curved downward if the object undergoes constant acceleration. 9 Graphical Analysis: Motion 2. The displacement x of an object moving along the x-axis is shown below as a function of time t. The acceleration of this object must be: A. zero B. constant but non-zero C. increasing D. decreasing E. equal to g 10 PS-2899A Student Worksheet (S) 3. Assume a ball is thrown with initial velocity vo at an angle with the horizontal and follows a typical parabolic trajectory. Suppose then that you graphed the vertical components of the object's velocity and its acceleration as functions of time. Which pair of graphs below would best represent the vertical components of its velocity and acceleration with respect to time t? A. B. C. D. E. 11


