Name - Montclair State University
advertisement
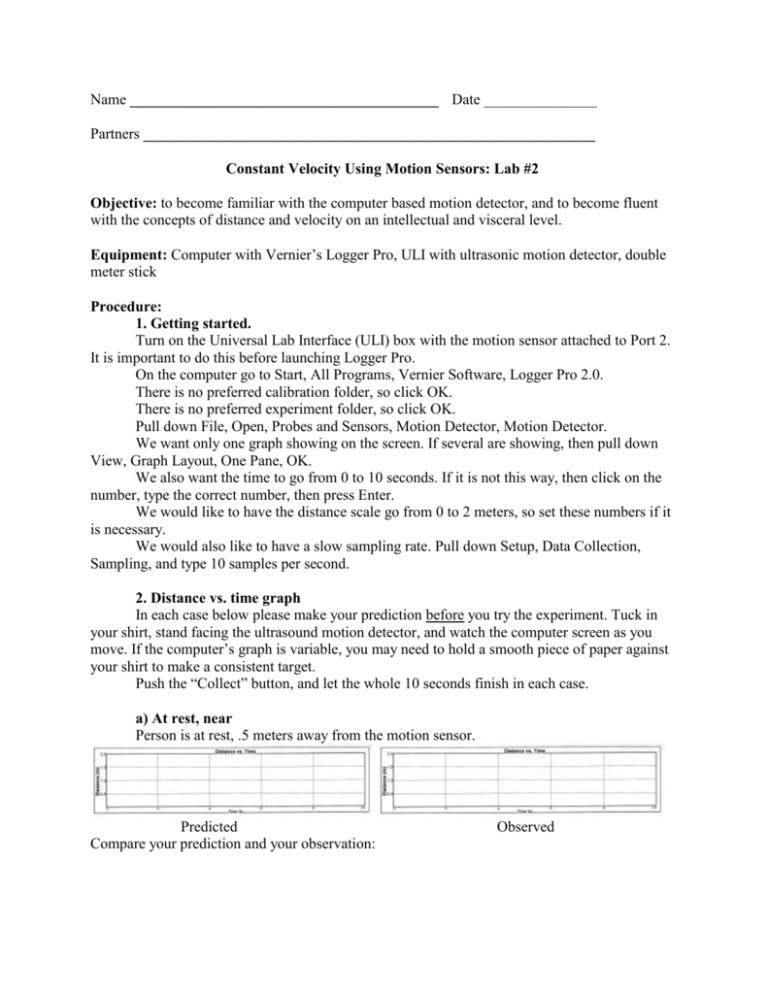
Name _________________________________________ Date _______________ Partners ____________________________________________________________ Constant Velocity Using Motion Sensors: Lab #2 Objective: to become familiar with the computer based motion detector, and to become fluent with the concepts of distance and velocity on an intellectual and visceral level. Equipment: Computer with Vernier’s Logger Pro, ULI with ultrasonic motion detector, double meter stick Procedure: 1. Getting started. Turn on the Universal Lab Interface (ULI) box with the motion sensor attached to Port 2. It is important to do this before launching Logger Pro. On the computer go to Start, All Programs, Vernier Software, Logger Pro 2.0. There is no preferred calibration folder, so click OK. There is no preferred experiment folder, so click OK. Pull down File, Open, Probes and Sensors, Motion Detector, Motion Detector. We want only one graph showing on the screen. If several are showing, then pull down View, Graph Layout, One Pane, OK. We also want the time to go from 0 to 10 seconds. If it is not this way, then click on the number, type the correct number, then press Enter. We would like to have the distance scale go from 0 to 2 meters, so set these numbers if it is necessary. We would also like to have a slow sampling rate. Pull down Setup, Data Collection, Sampling, and type 10 samples per second. 2. Distance vs. time graph In each case below please make your prediction before you try the experiment. Tuck in your shirt, stand facing the ultrasound motion detector, and watch the computer screen as you move. If the computer’s graph is variable, you may need to hold a smooth piece of paper against your shirt to make a consistent target. Push the “Collect” button, and let the whole 10 seconds finish in each case. a) At rest, near Person is at rest, .5 meters away from the motion sensor. Predicted Compare your prediction and your observation: Observed 2 b) At rest, far Person at rest, 2.0 meters away from the sensor. Predicted Observed c) Constant velocity away from the detector Person moving from .5 to 2.0 meters away at a constant velocity. Predicted Observed d) At rest then constant velocity away Person at rest at .5 meters for 3 seconds, then moving away at a constant velocity faster than before. Predicted Observed A faster velocity looks ______________________________ on the graph. e) At rest then constant velocity toward Person at rest at 2.0 meters for 3 seconds, then moving slowly toward the detector at a constant velocity. Predicted Observed 3 f) Velocity combinations Person at rest at .5 m for 3 seconds, then moving away at a constant velocity, then at rest, then moving toward the detector at a constant velocity. Predicted Observed g) Matching a distance vs. time curve. Pull down File, Open, Distance Match.MBL. Please do NOT save any changes. Try to match this curve. Note that the time goes to 20 seconds. Read the distance scale carefully. It is OK if your distance is somewhat less than the given curve. You may need to try this several times. It is not as easy as it looks, is it? Particularly notice the time delay in putting the plot up on the screen. To be matched Observed Describe how you moved to match this sample: I rested for … 3. Velocity vs. time graph Pull down File, Open, Motion Detector.MBL again. Please do NOT save any changes. (If necessary do View, Graph layout, one pane. Setup, Data collection, sampling, 10.) Click on the word “Distance” on the vertical axis and choose “Velocity” from the popup menu. Remove the check in front of “Distance” also. Make sure that the velocity runs from -2 to 2 m/s. Time should run from 0 to 10 seconds. h) At rest Person at rest, .5 meters away. Predicted Compare your prediction with your observation: Observed 4 i) At rest, far Person at rest, 2.0 meters from the detector. Predicted Observed j) Constant velocity away from the detector Person moving from .5 to 2.0 meters away at a constant slow velocity. Predicted Observed Now we want to store this observation temporarily. Pull down Data, Store Latest Run. k) Faster constant velocity away Person at rest at .5 meters for 3 seconds, then moving away at a constant faster velocity. Predicted Observed How does this graph look different from the previous observed graph? l) Velocity toward the detector Person at rest at 2.0 meters for 3 seconds, then moving slowly toward the detector at a constant velocity. Predicted Observed 5 m) Combination of velocities Person at rest at .5 m for 3 seconds, then moving away at a constant velocity, then at rest, then moving toward at a constant velocity. Predicted Observed n) Matching a velocity vs. time curve. Pull down File, Open, VelocityMatch.MBL Please do not save any changes. Set data sampling to 10 samples per second. Set velocity to –1.0 to 1.0 m/s. To be matched Observed Describe how you had to move to match this sample: Which is easier for you to match, distance or velocity? __________________________ 4. Both distance and velocity vs. time File, Open, MotionDetector.MBL again. Please do not save any changes. View, Graph Layout, Two Panes, OK Make the upper panel Distance from 0 to 2 m. Make the lower panel Velocity from -2 to 2 m/s. o) Combination of velocities Person still at .5 m for 3 seconds, then moving to 2 m at a constant velocity, then still. Predicted Observed Turn off the ULI, quit Logger Pro. 5. Further Research: Make several suggestions as to further use for this equipment.


