TEACHER: LINDSEY
advertisement
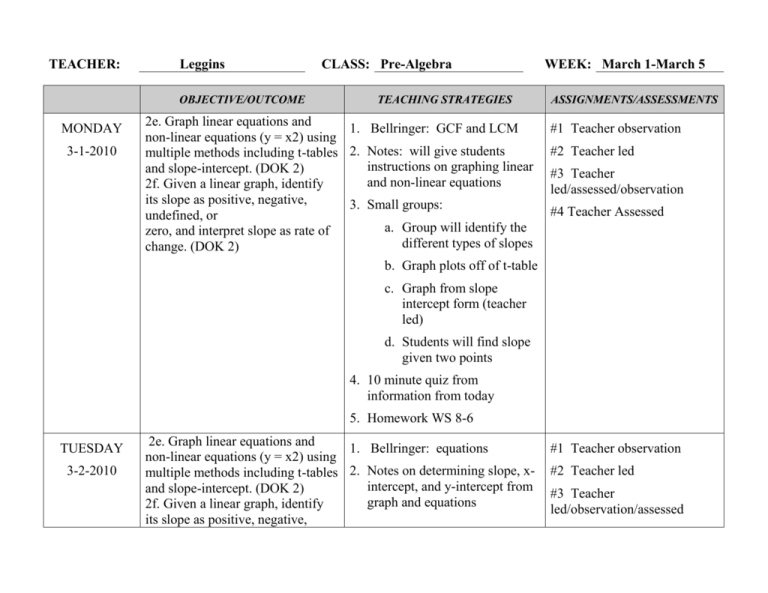
TEACHER: Leggins OBJECTIVE/OUTCOME MONDAY 3-1-2010 CLASS: Pre-Algebra TEACHING STRATEGIES 2e. Graph linear equations and 1. Bellringer: GCF and LCM non-linear equations (y = x2) using multiple methods including t-tables 2. Notes: will give students instructions on graphing linear and slope-intercept. (DOK 2) and non-linear equations 2f. Given a linear graph, identify its slope as positive, negative, 3. Small groups: undefined, or a. Group will identify the zero, and interpret slope as rate of different types of slopes change. (DOK 2) b. Graph plots off of t-table WEEK: March 1-March 5 ASSIGNMENTS/ASSESSMENTS #1 Teacher observation #2 Teacher led #3 Teacher led/assessed/observation #4 Teacher Assessed c. Graph from slope intercept form (teacher led) d. Students will find slope given two points 4. 10 minute quiz from information from today 5. Homework WS 8-6 TUESDAY 3-2-2010 2e. Graph linear equations and 1. Bellringer: equations non-linear equations (y = x2) using multiple methods including t-tables 2. Notes on determining slope, xintercept, and y-intercept from and slope-intercept. (DOK 2) graph and equations 2f. Given a linear graph, identify its slope as positive, negative, #1 Teacher observation #2 Teacher led #3 Teacher led/observation/assessed undefined, or zero, and interpret 3. Small groups: slope as rate of change. (DOK 2) a. Group will find x and y 2g. Determine slope, x-intercept, intercept by substituting and y-intercept from a graph and/or “0” in y=mx+b form equation in slope-intercept or b. Group will find x and y standard form. (DOK 1) intercept by substituting “0” in standard form #4 Teacher Assessed c. Groups will look at graphs and determine x and y intercept d. Groups will look at graph and determine slope. e. Students will take a groups quiz on information from yesterday. Groups will work together to answer questions 4. 10 minute quiz from new information today WEDNESDAY 3-3-2010 2e. Graph linear equations and 1. Bellringer: polynomials non-linear equations (y = x2) using multiple methods including t-tables 2. Notes on graphing information given y=mx+b and standard and slope-intercept. (DOK 2) form 2f. Given a linear graph, identify its slope as positive, negative, 3. Students will work #1 Teacher observation #2 Teacher Led #3 Teacher observation #4 Teacher led/Teacher undefined, or zero, and interpret independently on graphing slope as rate of change. (DOK 2) y=mx+b and standard form 2g. Determine slope, x-intercept, 4. After going over information and y-intercept from a graph and/or students look at graphs and go equation in slope-intercept or over characteristics of graphs standard form. (DOK 1) 5. HW: 8-9 THURSDAY 3-4-2010 2i. Predict characteristics of a graph given an equation or t-table. (DOK 2) 1. Bellringer: inequalities observation #1 Teacher observation 2. Notes on ways graphs move for #2 linear and nonlinear equations #3 3. Students will partner up and #4 work on predicting graphs #5 4. Review for Test Teacher led Teacher observation Teacher led Teacher Assessed 5. Mixed Practice Quiz FRIDAY 3-5-2010 2e. Graph linear equations and 1. Bellringer: students will be non-linear equations (y = x2) using given time to look over notes multiple methods including t-tables before test and slope-intercept. (DOK 2) 2. Students will take test on 2f. Given a linear graph, identify its slope as positive, negative, a. 2e undefined, or zero, and interpret b. 2f slope as rate of change. (DOK 2) 2g. Determine slope, x-intercept, c. 2g and y-intercept from a graph and/or d. 2i equation in slope-intercept or standard form. (DOK 1) #1 Teacher observation #2 Teacher Assessed 2i. Predict characteristics of a graph given an equation or t-table. (DOK 2)
