TimeOverlap readme
advertisement
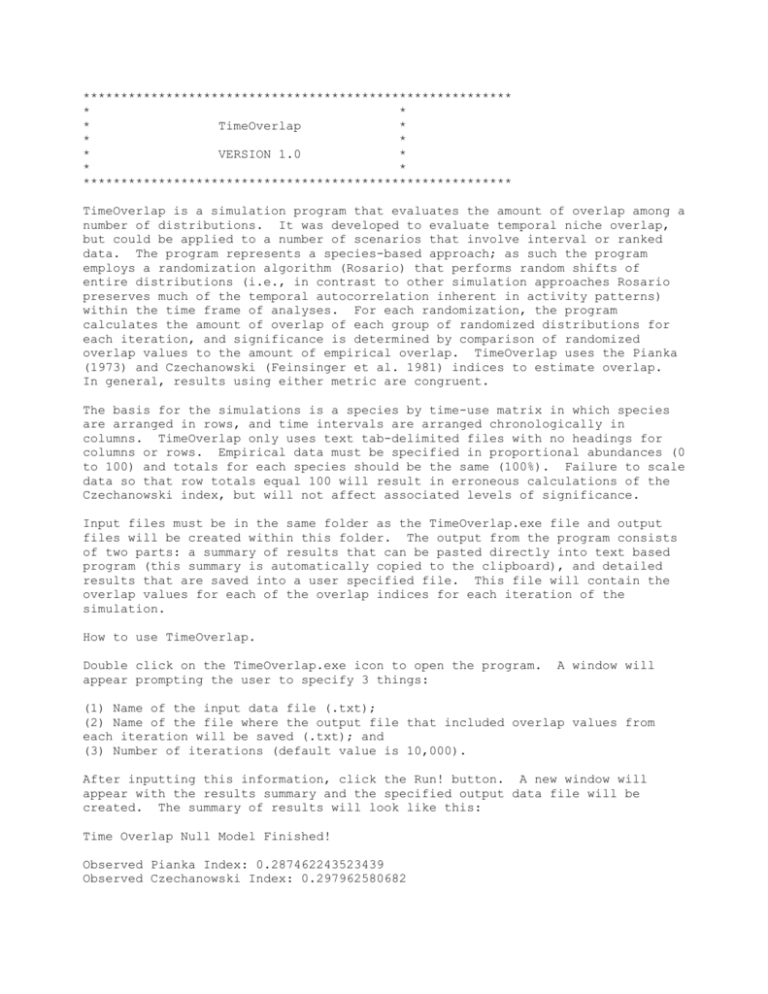
********************************************************* * * * TimeOverlap * * * * VERSION 1.0 * * * ********************************************************* TimeOverlap is a simulation program that evaluates the amount of overlap among a number of distributions. It was developed to evaluate temporal niche overlap, but could be applied to a number of scenarios that involve interval or ranked data. The program represents a species-based approach; as such the program employs a randomization algorithm (Rosario) that performs random shifts of entire distributions (i.e., in contrast to other simulation approaches Rosario preserves much of the temporal autocorrelation inherent in activity patterns) within the time frame of analyses. For each randomization, the program calculates the amount of overlap of each group of randomized distributions for each iteration, and significance is determined by comparison of randomized overlap values to the amount of empirical overlap. TimeOverlap uses the Pianka (1973) and Czechanowski (Feinsinger et al. 1981) indices to estimate overlap. In general, results using either metric are congruent. The basis for the simulations is a species by time-use matrix in which species are arranged in rows, and time intervals are arranged chronologically in columns. TimeOverlap only uses text tab-delimited files with no headings for columns or rows. Empirical data must be specified in proportional abundances (0 to 100) and totals for each species should be the same (100%). Failure to scale data so that row totals equal 100 will result in erroneous calculations of the Czechanowski index, but will not affect associated levels of significance. Input files must be in the same folder as the TimeOverlap.exe file and output files will be created within this folder. The output from the program consists of two parts: a summary of results that can be pasted directly into text based program (this summary is automatically copied to the clipboard), and detailed results that are saved into a user specified file. This file will contain the overlap values for each of the overlap indices for each iteration of the simulation. How to use TimeOverlap. Double click on the TimeOverlap.exe icon to open the program. appear prompting the user to specify 3 things: A window will (1) Name of the input data file (.txt); (2) Name of the file where the output file that included overlap values from each iteration will be saved (.txt); and (3) Number of iterations (default value is 10,000). After inputting this information, click the Run! button. A new window will appear with the results summary and the specified output data file will be created. The summary of results will look like this: Time Overlap Null Model Finished! Observed Pianka Index: 0.287462243523439 Observed Czechanowski Index: 0.297962580682 Pianka: Randomizations less than observed: 2 Pianka: Randomizations equal to the observed: 0 Pianka: Randomizations higher than the observed: 9998 Czechanowski: Randomizations less than observed: 1 Czechanowski: Randomizations equal to the observed: 0 Czechanowski: Randomizations higher than the observed: 9999 Analytical results copied to the clipboard (Use MS Word to paste) Detailed results exported to the file specified. If an a priori expectation exists that temporal overlap should be greater than expected by chance(coincident activities), then a one-tailed test is conducted and the p-value is calculated as the proportion of randomizations that have an overlap that is equal to or greater that the empirical overlap value (observed). Alternatively, if there is an a priori expectation that temporal overlap should be less than expected by chance (segregated activities), then a one-tailed test is conducted and the p-value is calculated as the proportion of randomizations that resulted in overlap that is equal to or less than the empirical overlap value (observed). In the absence of an a priori directional expectation, a two-tailed test is conducted. To determine the p-value, one must double the lower of two values: (1) the proportion of randomizations that resulted in overlap that was equal to or less than the empirical value, or (2)the proportion of randomizations that resulted in overlap that was equal to or greater than the empirical value. For example, in the summary of results for a one-tailed test that is appears above, the simulations indicate that the distributions overlap significantly less than expected by chance (p-value for Pianka = 0.0002; p-value for Czechanowski = 0.0001). As stated in the main paper, the results from TimeOverlap can be contrasted with those from other simulations models (RA3 & RA4) implemented by Ecosim (Gotelli and Entsminger 2004). Literature cited Feinsinger, P., E. E. Spears, and R. W. Poole. breadth. Ecology 62:27-32. 1981. A simple measure of niche Gotelli, N. J. and Entsminger, G. L. 2004. EcoSim: null models software for ecology. (V. 7.0). Acquired Intelligence and Kesey-Bear. Jericho, VT. Pianka, E. R. 1973. The structure of lizard communities. Ecology and Systematics 4:53-74. Annual Review of
