PHYSICS FORMAL LAB
advertisement
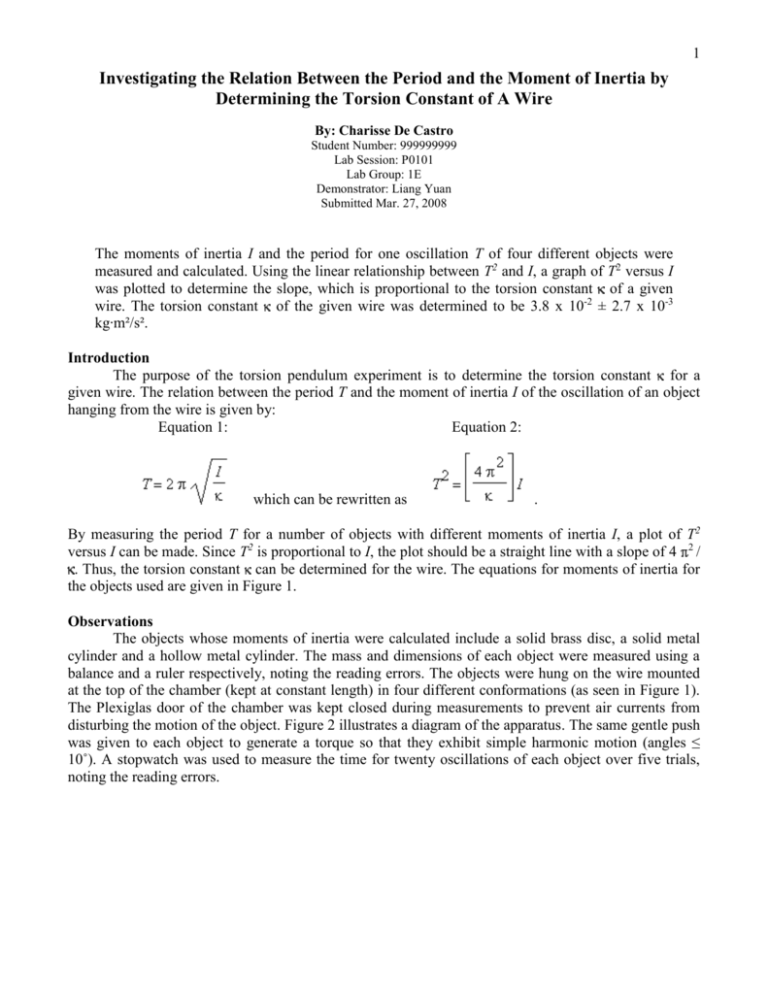
1 Investigating the Relation Between the Period and the Moment of Inertia by Determining the Torsion Constant of A Wire By: Charisse De Castro Student Number: 999999999 Lab Session: P0101 Lab Group: 1E Demonstrator: Liang Yuan Submitted Mar. 27, 2008 The moments of inertia I and the period for one oscillation T of four different objects were measured and calculated. Using the linear relationship between T2 and I, a graph of T2 versus I was plotted to determine the slope, which is proportional to the torsion constant of a given wire. The torsion constant of the given wire was determined to be 3.8 x 10⁻² ± 2.7 x 10⁻³ kg∙m²/s². Introduction The purpose of the torsion pendulum experiment is to determine the torsion constant for a given wire. The relation between the period T and the moment of inertia I of the oscillation of an object hanging from the wire is given by: Equation 1: Equation 2: which can be rewritten as . By measuring the period T for a number of objects with different moments of inertia I, a plot of T2 versus I can be made. Since T2 is proportional to I, the plot should be a straight line with a slope of 4 2 / . Thus, the torsion constant can be determined for the wire. The equations for moments of inertia for the objects used are given in Figure 1. Observations The objects whose moments of inertia were calculated include a solid brass disc, a solid metal cylinder and a hollow metal cylinder. The mass and dimensions of each object were measured using a balance and a ruler respectively, noting the reading errors. The objects were hung on the wire mounted at the top of the chamber (kept at constant length) in four different conformations (as seen in Figure 1). The Plexiglas door of the chamber was kept closed during measurements to prevent air currents from disturbing the motion of the object. Figure 2 illustrates a diagram of the apparatus. The same gentle push was given to each object to generate a torque so that they exhibit simple harmonic motion (angles ≤ 10˚). A stopwatch was used to measure the time for twenty oscillations of each object over five trials, noting the reading errors. 2 Example 1: A disc of mass M, radius r and thickness t oscillating around the diameter that goes through the center of mass. Example 4: A hollow cylinder of mass M, length L, inner radius a and outer radius b. Example 2: The same disc as before, but oscillating around the perpendicular to its face through the center. Example 5: A hollow cylinder of mass M1, length L, inner radius a and outer radius b combined with a cylinder of mass M2, radius a and length t. Figure 1. The equations of moments of inertia for the four objects used. [1] Figure 2. The apparatus used to measure the objects’ period of oscillation. [1] Analysis Using the mass and dimensions of the objects, the moments of inertia (I) were calculated with the equations in Figure 1 for the four examples. The average time for twenty oscillations (20T) of each object over five trials was calculated by adding up the times and dividing the sum by five. The average 3 period (T) for one oscillation was then calculated by dividing the average time for twenty oscillations of each object by twenty. Standard errors were calculated using known error formulae. Table 1 lists the final values used in plotting the graph T2 versus I. Using the lab computer Faraday, a plot of T2 versus I was created, where I was chosen as the independent variable and T2 as the dependent variable, with errors dI and dT2 respectively, as illustrated by Figure 3. Since T2 is proportional to I, the plot should be a straight line. Using the least-squares fit of the data to a linear function, the slope of the line of best fit 2 / as given by Equation 2, the value of the torsion constant for the wire was determined, noting the standard error. Object Hollow + Solid Cylinder Hollow Cylinder Vertical Disc Horizontal Disc Moment of Inertia, I (kg∙m²) 3.617 x 10⁻³ ± 3.5 x 10⁻⁵ 1.659 x 10⁻³ ± 3.4 x 10⁻⁵ 2.176 x 10⁻³ ± 3.3 x 10⁻⁴ 1.087 x 10⁻³ ± 1.3 x 10⁻⁵ Period For One Oscillation, T (s) 1.990 ± 0.0001 1.339 ± 0.0001 1.581 ± 0.0001 1.159 ± 0.0001 Table 1. Final values used to plot the graph T2 versus I. Figure 3. The plot of T2 versus I with errors dT2 and dI respectively, fitted with a least-squares fit. The slope of the line of best fit is determined to be Different objects have different moments of inertia since the mass is distributed differently about the axis of rotation. Consequently, the objects hanging from the wire would also have different periods 4 of oscillation. However, different values of I and T share a common factor of if the objects are hung from the same wire at a constant length, as given by Equation 1 and 2. Using this relationship, the torsion constant of the given wire was determined to be 3.8 x 10⁻² ± 2.7 x 10⁻³ kg∙m²/s², which is a reasonable value for a metal wire. The line of best fit, as illustrated by the plot on Figure 3, fit the data quite well within the standard error bars, confirming the linear relationship between T2 and I. However, this experiment can be improved by measuring the period for twenty oscillations in more than five trials, to further illustrate the relationship between the period and the moment of inertia by minimizing error. More data points can be plotted to emphasize this relationship by calculating T and I for other objects on the same wire. Conclusion The torsion constant of the given wire was determined to be 3.8 x 10⁻² ± 2.7 x 10⁻³ kg∙m²/s², which is a reasonable value for a metal wire. The relationship between the period and the moment of inertia as given by Equations 1 and 2 is confirmed by the linear relationship between T2 and I, with a slope of 4 2 / . The main source of error in this experiment is reading error, especially in the measurement of the time for twenty oscillations. References 1. Harrison, D. Torsion Pendulum Experiment. http://faraday.physics.utoronto.ca/IYearLab/Intros/TorsionPend/TorsionPend.html. Published October 2002. Accessed January 22, 2008.
