Fixing a State on a P-v/T
advertisement
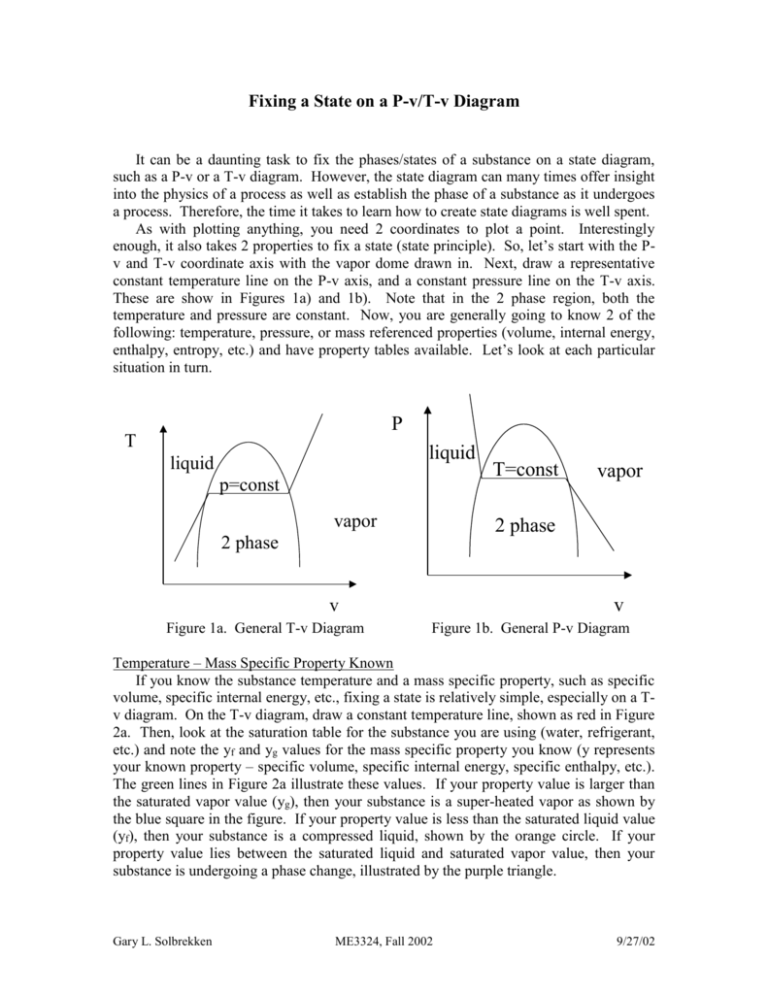
Fixing a State on a P-v/T-v Diagram It can be a daunting task to fix the phases/states of a substance on a state diagram, such as a P-v or a T-v diagram. However, the state diagram can many times offer insight into the physics of a process as well as establish the phase of a substance as it undergoes a process. Therefore, the time it takes to learn how to create state diagrams is well spent. As with plotting anything, you need 2 coordinates to plot a point. Interestingly enough, it also takes 2 properties to fix a state (state principle). So, let’s start with the Pv and T-v coordinate axis with the vapor dome drawn in. Next, draw a representative constant temperature line on the P-v axis, and a constant pressure line on the T-v axis. These are show in Figures 1a) and 1b). Note that in the 2 phase region, both the temperature and pressure are constant. Now, you are generally going to know 2 of the following: temperature, pressure, or mass referenced properties (volume, internal energy, enthalpy, entropy, etc.) and have property tables available. Let’s look at each particular situation in turn. P T liquid liquid p=const vapor vapor 2 phase 2 phase v v Figure 1a. General T-v Diagram T=const Figure 1b. General P-v Diagram Temperature – Mass Specific Property Known If you know the substance temperature and a mass specific property, such as specific volume, specific internal energy, etc., fixing a state is relatively simple, especially on a Tv diagram. On the T-v diagram, draw a constant temperature line, shown as red in Figure 2a. Then, look at the saturation table for the substance you are using (water, refrigerant, etc.) and note the yf and yg values for the mass specific property you know (y represents your known property – specific volume, specific internal energy, specific enthalpy, etc.). The green lines in Figure 2a illustrate these values. If your property value is larger than the saturated vapor value (yg), then your substance is a super-heated vapor as shown by the blue square in the figure. If your property value is less than the saturated liquid value (yf), then your substance is a compressed liquid, shown by the orange circle. If your property value lies between the saturated liquid and saturated vapor value, then your substance is undergoing a phase change, illustrated by the purple triangle. Gary L. Solbrekken ME3324, Fall 2002 9/27/02 T vf vg v Figure 2. T-v Diagram for a Known Temperature and Mass Specific Property Pressure – Mass Specific Property Known The case where the pressure and a mass specific property are known is the same as the known temperature case, except it is easiest to use a P-v diagram and initially draw a line of constant pressure. Locating the state then uses the same process of using the saturation tables of the substance. Temperature – Pressure Known The process to find the state when the temperature and pressure are known is a little more difficult. Either a T-v or a P-v diagram can be used, although a P-v diagram is many times better to use since the area under the curve illustrating the process has the physical meaning of the work done during the process. So, start by drawing a constant temperature line on a P-v diagram (red line of Figure 3). Assume this line to be the known temperature of your substance, Ta. Next, use the saturation tables to determine the saturation pressure at Ta. This is shown in the Figure as Psat. Now, compare the known pressure of your substance, Pa, to the saturation pressure. If Pa > Psat, then the line for Pa is drawn in above the Psat line, as shown by the dotted orange line in the Figure. The intersection of the Pa pressure line and the Ta temperature line fixes the state, shown by the orange dot. In this case the phase is a compressed liquid. If the known pressure is less than the saturation pressure, the line for Pa is drawn in below the Psat line, as shown by the dotted blue line. The intersection of the pressure and temperature lines at the blue square suggests that the substance phase is a super-heated vapor. Finally, if the known pressure is equal to the saturation pressure, then the substance is undergoing a phase chance, and more information is needed to fix the state. This is shown by the black dotted line in the figure. The process to fix the state on a T-v diagram is exactly the same, except a constant pressure line is drawn in initially, and the saturation temperature at that pressure is looked up in the saturation tables. Gary L. Solbrekken ME3324, Fall 2002 9/27/02 Ta=const P Pa > Psat Pa = Psat Psat Pa > Psat v Figure 3. Fixing the State on a P-v Diagram when the Temperature and Pressure are Known. Gary L. Solbrekken ME3324, Fall 2002 9/27/02
