Telecommunication Transmission Methods Tutorial
advertisement
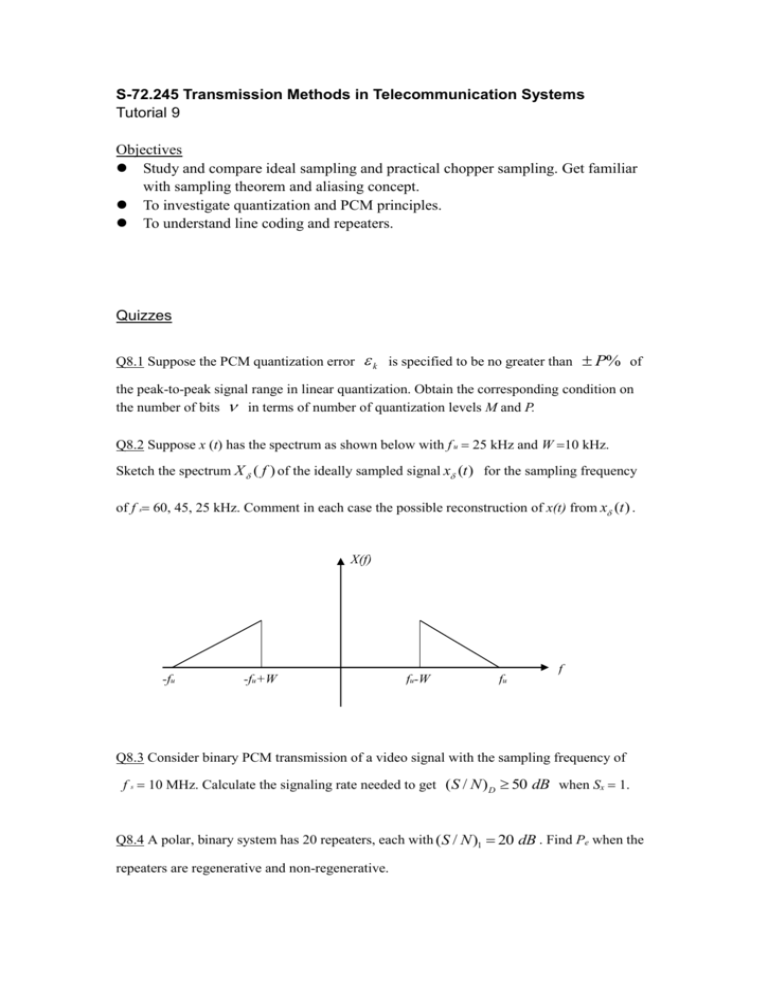
S-72.245 Transmission Methods in Telecommunication Systems Tutorial 9 Objectives Study and compare ideal sampling and practical chopper sampling. Get familiar with sampling theorem and aliasing concept. To investigate quantization and PCM principles. To understand line coding and repeaters. Quizzes Q8.1 Suppose the PCM quantization error k is specified to be no greater than P% of the peak-to-peak signal range in linear quantization. Obtain the corresponding condition on the number of bits in terms of number of quantization levels M and P. Q8.2 Suppose x (t) has the spectrum as shown below with f u 25 kHz and W kHz. Sketch the spectrum X ( f ) of the ideally sampled signal x (t ) for the sampling frequency of f s 60, 45, 25 kHz. Comment in each case the possible reconstruction of x(t) from x (t ) . X(f) -fu -fu+W fu-W fu f Q8.3 Consider binary PCM transmission of a video signal with the sampling frequency of f s MHz. Calculate the signaling rate needed to get (S / N ) D 50 dB when Sx . Q8.4 A polar, binary system has 20 repeaters, each with (S / N )1 20 dB . Find Pe when the repeaters are regenerative and non-regenerative. Q8.5 The zero-order hold circuit shown in the figure below is often used to reconstruct signal x(t) from its samples. input Delay Ts - output + a) Find the impulse response of this circuit. b) Find the respective transfer function H ( ) c) Show that when xs(t) is applied at the input of this circuit, the output is a staircase approximation of x(t). The sampling interval is T s. Matlab assignments M8.1 Plot cos(2 10t ) and cos(2 70t ) for 0 t 1/10 on the same axis by using Matlab, and find the sample values at t 0, 1/80, 2 / 80,..., 8 /80, which correspond to the sampling frequency of f s 80 Hz . M8.2 Generate 1 rad/s, unit amplitude sinusoidal signal. Then quantize it by using uniform PCM sampling to (a) 8, (b) 16 levels. Plot the original signal and the respective quantized signals on the same figure.
