1102 App F
advertisement
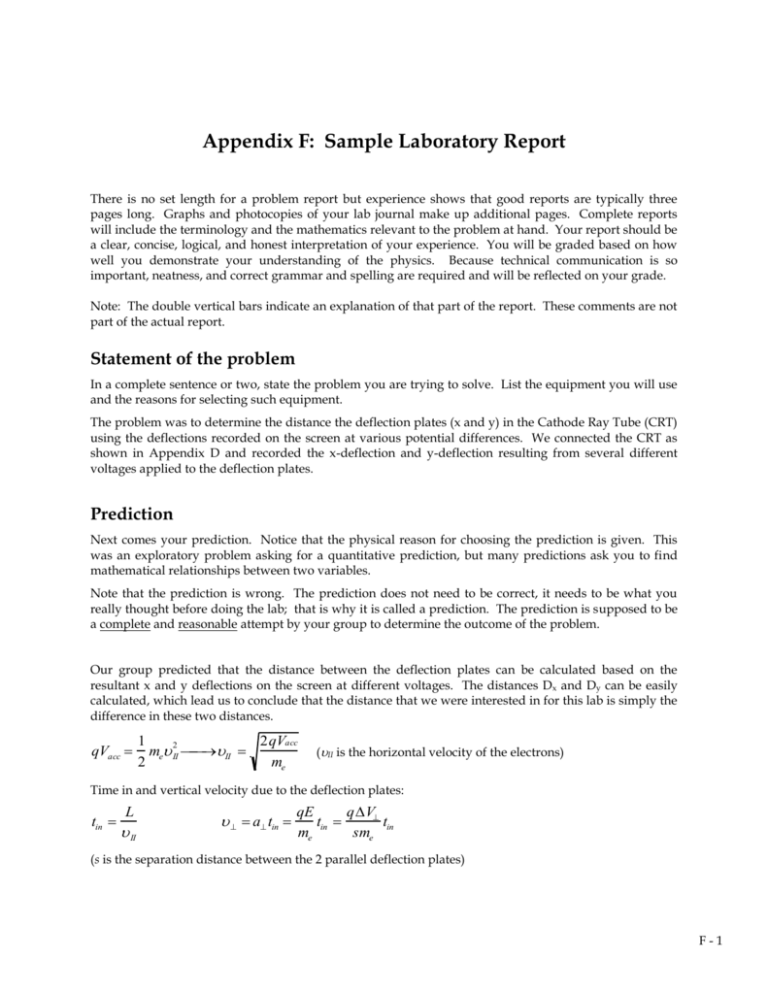
Appendix F: Sample Laboratory Report There is no set length for a problem report but experience shows that good reports are typically three pages long. Graphs and photocopies of your lab journal make up additional pages. Complete reports will include the terminology and the mathematics relevant to the problem at hand. Your report should be a clear, concise, logical, and honest interpretation of your experience. You will be graded based on how well you demonstrate your understanding of the physics. Because technical communication is so important, neatness, and correct grammar and spelling are required and will be reflected on your grade. Note: The double vertical bars indicate an explanation of that part of the report. These comments are not part of the actual report. Statement of the problem In a complete sentence or two, state the problem you are trying to solve. List the equipment you will use and the reasons for selecting such equipment. The problem was to determine the distance the deflection plates (x and y) in the Cathode Ray Tube (CRT) using the deflections recorded on the screen at various potential differences. We connected the CRT as shown in Appendix D and recorded the x-deflection and y-deflection resulting from several different voltages applied to the deflection plates. Prediction Next comes your prediction. Notice that the physical reason for choosing the prediction is given. This was an exploratory problem asking for a quantitative prediction, but many predictions ask you to find mathematical relationships between two variables. Note that the prediction is wrong. The prediction does not need to be correct, it needs to be what you really thought before doing the lab; that is why it is called a prediction. The prediction is supposed to be a complete and reasonable attempt by your group to determine the outcome of the problem. Our group predicted that the distance between the deflection plates can be calculated based on the resultant x and y deflections on the screen at different voltages. The distances Dx and Dy can be easily calculated, which lead us to conclude that the distance that we were interested in for this lab is simply the difference in these two distances. qVacc 1 2qVacc me 2II II 2 me (II is the horizontal velocity of the electrons) Time in and vertical velocity due to the deflection plates: tin L II a tin qE qV tin t me sme in (s is the separation distance between the 2 parallel deflection plates) F-1 APPENDIX F: SAMPLE LAB REPORT 1 a tin2 t out 2 1 D a tin2 2 vII Deflection (L is the length of the length of the plates; V is the potential difference; D is the distance between the deflection plates and the screen of the CRT) 2 1 q V L qV L D 2 sme v II sme v II v II qV L 1 L D 2 sme v II 2 Slopes of x and y deflections vs. potential differences: L 1 2sVacc L2 mx L Dx Dx mx 2sVacc 2 L 4sVacc my L 1 2sVacc L Dy Dy 2sVacc 2 L L2 my 4sVacc Distance between x and y deflection plates: 2sVacc L2 2sVacc L2 my mx L 4sVacc L 4sVacc 2sVacc my mx L Dy Dx With some of the variables given in the laboratory manual, we can calculate this distance after taking our measurements and see whether the result is reasonable. D V acc tot D Deflection plates 6.3 V AC L electron beam S Electron gun Vy F-2 Vx APPENDIX F: SAMPLE LAB REPORT Experiment and Results This section describes your experimental method, the data that you collected, any problems in gathering the data, and any crucial decisions you made. Your actual results should show you if your prediction was correct or not. After hooking up the CRT, we turned it on and arranged the screen so that an x-deflecting voltage would move the beam along the horizontal axis and a y-deflecting voltage would move the beam along the vertical axis. With no deflecting voltage, the electron beam did not hit the screen directly in the center -we took this point to be our reference point and measured our change in the x- and y-directions from it. We measured the x-deflection for 6 voltages between 0 and 5 Volts. We then did the same for the ydeflection. (See table 1 from the lab journal) A discussion of uncertainty should follow all measurements. No measurement is exact. Uncertainty must be included to indicate the reliability of your data. The largest uncertainty in our measurements came from the deflection of the electron beam from the screen on the CRT. Since the marks on the screen were every 1.0 mm and the electron beam was somewhat distorted, we estimated the uncertainty of our deflection measurements to be 0.5 mm. We verified this uncertainty measurement by having each member of our group measure the x- and yposition of the electron beam at two test points. All measurements were within the stated uncertainty. The uncertainties in our measurement also lead to uncertainties in the slopes of the deflection vs. potential difference graph; the slopes were found to have uncertainties of 0.09 mm/V for x and 0.08 mm/V for y. Using the values given in the manual, and those found from the experiment, we calculated the distance between the x and y deflection plates to be 36 mm with an uncertainty of 12mm. Conclusions This section summarizes your results. In the most concise manner possible, it answers the original question of the lab. When we graphed the results from our data table, we saw that the y-deflection plates gave us a larger deflection at each deflection voltage used in the experiment. (See Graph A from the lab journal) A good conclusion will always compare actual results with the predictions. If your prediction was incorrect, then you must discuss where your reasoning went wrong. If your prediction was correct, then you should review your reasoning and discuss how this lab served to confirm your knowledge of the basic physical concepts. The result of our experiment is consistent with the dimensions of the CRT. The total length from the accelerating voltage plates to the screen is 96mm, and our result showed that the distance between the x and y deflecting plates is somewhere in the range of 24mm to 48mm. The upper bound value may be unlikely, since it wonít leave much room for anything else to fit in the CRT. However, this doesnít mean that the range is unreasonable; any value in the range can still be made to fit inside the CRT. After discussing this as a group we realized that we had over estimated the x- and y-position measurements, and the upper bound value is the result of this. When we thought about the situation more carefully, we realized that we were correct in thinking that an electron is always traveling with the same velocity parallel to the CRT and that the time it is inside each F-3 APPENDIX F: SAMPLE LAB REPORT deflection plate will be the same. Thus, at the far edge of each deflecting plate the electron beam has the same perpendicular velocity. Recalling our kinematics from last semester, we realized that this perpendicular velocity will be independent of the parallel velocity. Since the electron beam takes longer to travel from the far edge of the y-deflecting plates (the y-plates are further from the screen) than from the x-deflecting plates, the electron beam under y-deflection will have more time during which it has a yvelocity, and thus it will be deflected more. This allowed us to make the right assumptions and thus yielded a reasonable result. After you have compared your predictions to your measured results, it is helpful to look at the data from an alternative perspective. This should be a short exercise demonstrating to yourself and to your TA that you understand the basic physics behind the problem. The situation in this problem is similar to the situation in which a moving soccer ball is moving past two people (See diagram 1 from the lab journal). Either of these two people can kick it perpendicularly to its direction of motion. The diagram shows the resulting position when it reaches the edge of the field when person A kicks it (solid line) versus when person B kicks it (dashed line). Person A is further away from the edge of the field and, thus, her kick results in a greater deflection of the ball. This difference in deflection can be used to determine how far apart the two kickers are. F-4 APPENDIX F: SAMPLE LAB REPORT F-5 APPENDIX F: SAMPLE LAB REPORT F-6
