Chapter 9- Atomic Absorption and Atomic Fluorescence Spectrometry
advertisement
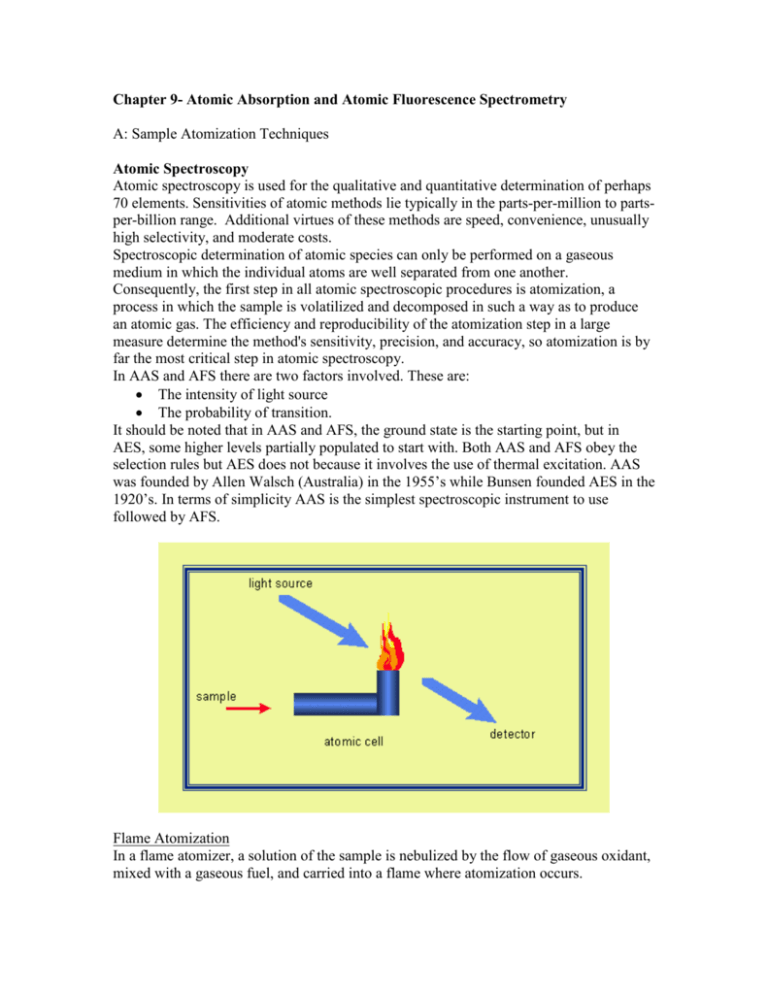
Chapter 9- Atomic Absorption and Atomic Fluorescence Spectrometry A: Sample Atomization Techniques Atomic Spectroscopy Atomic spectroscopy is used for the qualitative and quantitative determination of perhaps 70 elements. Sensitivities of atomic methods lie typically in the parts-per-million to partsper-billion range. Additional virtues of these methods are speed, convenience, unusually high selectivity, and moderate costs. Spectroscopic determination of atomic species can only be performed on a gaseous medium in which the individual atoms are well separated from one another. Consequently, the first step in all atomic spectroscopic procedures is atomization, a process in which the sample is volatilized and decomposed in such a way as to produce an atomic gas. The efficiency and reproducibility of the atomization step in a large measure determine the method's sensitivity, precision, and accuracy, so atomization is by far the most critical step in atomic spectroscopy. In AAS and AFS there are two factors involved. These are: The intensity of light source The probability of transition. It should be noted that in AAS and AFS, the ground state is the starting point, but in AES, some higher levels partially populated to start with. Both AAS and AFS obey the selection rules but AES does not because it involves the use of thermal excitation. AAS was founded by Allen Walsch (Australia) in the 1955’s while Bunsen founded AES in the 1920’s. In terms of simplicity AAS is the simplest spectroscopic instrument to use followed by AFS. Flame Atomization In a flame atomizer, a solution of the sample is nebulized by the flow of gaseous oxidant, mixed with a gaseous fuel, and carried into a flame where atomization occurs. The first step is de-solvation, in which the solvent is evaporated to produce a finely divided solid molecular aerosol. As a result de-solvation of these molecules then leads to an atomic gas. Some of the atoms ionize and give cations and electrons. Undoubtedly, other molecules and atoms are also produced in the flame as a result of interactions of the fuel with the oxidant and with various species in the sample. As shown in the diagram above, we see that the heat of the flame also excites a fraction of the molecules, atoms, and ions, thus giving atomic, ionic, and molecular emission spectra. Types of Flames The table below lists the common fuels and oxidants employed in flame spectroscopy and the approximate range of temperature realized with each of these mixtures. These temperatures in the range of 1700-2400oC were obtained with the various fuels when air serves as the oxidant. Air-Coal gas Max. flame speed (cm/s) Max. temp. (oC) 55 1840 Air-propane 82 1925 Air-hydrogen 320 2050 Air-50% oxygen-acetylene 160 2300 Oxygen-nitrogen-acetylene 640 2815 Oxygen-acetylene 1130 3060 Oxygen-cyanogen 140 4640 Nitrous oxide-acetylene 180 2955 Nitric oxide-acetylene 90 3095 Nitrogen dioxyde-hydrogen 150 2660 Nitrous oxide-hydrogen 390 2650 The burning velocities listed in the middle column are of considerable importance because flames are stable in certain ranges of gas flow rates only. If the gas flow rate does not exceed the burning velocity, the flame propagates itself back into the burner, giving flashback. As the flow rate increases, the flame rises until it reaches a point above the burner where the flow velocity and the burning velocity are equal. This region is where the flame is stable. Flame Structure In the figure, we see all the important regions of a flame. It includes the primary combustion zone, the interzonal region, and the secondary combustion zone. The appearance and relative size of these regions vary considerably with the fuel-to-oxidant ratio as well as with the type of fuel and oxidant. The primary combustion zone in a hydrocarbon flame is recognizable by its blue luminescence arising from the band spectra of C2 and CH, and other radicals. Thermal equilibrium is ordinarily not reached in this region, and it is seldom used for flame spectroscopy. Furthermore, the interzonal area, -which is narrow in stoichiometric hydrocarbon flames, may reach several centimeters in height in fuel rich acetylene/oxygen acetylene/nitrous oxide sources. The zone is rich in free atoms and it is the most widely used part of the flame. Temperature Profiles The maximum temperature is located in the flame about 1cm above the primary combustion zone. It is important- particularly for emission methods- to focus the same part of the flame on the entrance slit for all calibrations and analytical measurements. The Effects of Flame Temperature Both emission and absorption spectra are affected in a complex way by variations in flame temperature. Higher temperatures tend to increase the total atom population of the flame and sensitivity. With certain elements, such as the alkali metals, however, this iiincrease in atom population is more than offset by the loss of atoms by ionization, Also, flame temperature determines the relative number of excited and unexcited atoms in a flame. In an air/acetylene flame, for example, the ratio of excited to unexcited magnesium atoms can be computed to be about 10E-8, whereas in oxygen acetylene flame, which is about 700C hotter, this ratio is about 10E-6. Control of temperature is thus of prime importance in flame emission methods. For example, with a 2500 'C flame, a temperature increase of IO 'C causes the number of sodium atoms in the excited 3p state to increase by about 3%. In contrast, the corresponding decreases ii-a the much larger number of ground state atoms is only about 0.002%. So, emission methods based as they are on the population of excited atoms. Requires much closer control of flame temperature than do absorption procedures, in which the analytical signal depends upon the number of unexcited atoms. The number of unexcited atoms in a typical flame exceeds the number of excited ones by a factor of 10E3 to 10E10 or more. And this fact suggests that absorption methods should be significantly more sensitive than emission methods. Flame Absorbance Profiles A different portion of the flame should be used for the analysis of different elements. The more sophisticated instruments for flame spectroscopy are equipped with monochromators that sample the radiation from a relatively small region of the flame; adjustment of the position of the flame with respect to the entrance slit is thus critical. Flame Atomizers A flame atomizer of a pneumatic nebulizer, which converts the sample solution into a mist, or aerosol, that is then fed into a burner. A common type of nebulizer is the concentric tube type. In which the liquid sample is sucked through a capillary tube by -a high-pressure stream of a gas flowing around the tip of the tube. This process of liquid transport is called aspiration. The high velocity gas breaks the liquid into the fine droplets of various sizes, which are then carried into the flame. Cross-flow nebulizers are also employed in which the high-pressure gas flows across a capillary tip at right angles. Often in this type of nebulizer, the liquid is pumped through the capillary. In most atomizers, the high-pressure gas is the oxidant, with the aerosol containing oxidant being mixed subsequently with the fuel. On this figure we see a typical commercial laminar flow burner that employs a concentric tube nebulizer. The aerosol is mixed with fuel and flows past a series of baffles that remove all but the finest droplets. As a result of the baffles, the a-majority of the sample collects in the bottom of the mixing chamber, where it is drained to a waste container. The aerosol, oxidant, alit fuel are then directed into a slotted burner, which provides a flame that is usually 5 or 10 cm in length. Laminar flow burners provide a relatively quiet flame and a long path length. These properties tend to enhance sensitivity and reproducibility. The mixing chamber in this type of burner contains a potentially explosive mixture, which can be ignited by flashback if the flow rates are not sufficient. Fuel & Oxidant Regulators An important variable that requires close control in flame spectroscopy is the flow rate of both oxidant and fuel. Fuel and oxidant are ordinarily combined in approximately stoichiometric amounts. However, a flame that contains an excess of fuel may be more desirable. The most widely used device for measuring flow rates is the rotameter, which consists of tapered, graduated, transparent tube that is mounted vertically with the smaller end down. Performance Characteristics of Flame Atomizers Flame atomization appears to be superior to all other methods that have been thus far developed for liquid sample introduction for atomic absorption and fluorescence spectrometry. However there are two reasons that lower the sampling efficiency of the flame. First, a large portion of the sample flows down the drain. Second, the residence time of individual atoms in the optical path in the flame is brief. Sources of Atomic Spectra Without chemical bonding, there can be no vibrational or rotational energy states and transitions. Therefore, atomic emission absorption, and fluorescence spectra are made up of a limited number of narrow peaks, or lines. Electrothermal Atomization Electrothermal atomizers, which first appeared in 1970, generally provide enhanced sensitivity because the entire sample is atomized in a short period, and the average residence time of the atoms in the optical path is a second or more. They generally have not been applied for direct production of emission spectra. They are, however, beginning to be used for vaporizing samples for sample introduction in inductively coupled plasma emission spectroscopy. Electrothermal Atomizers Graphite furnace atomic absorption spectrometry (GFAAS) is also known by various other acronyms, including electrothermal atomic absorption spectrometry (ETAAS). Briefly, the technique is based on the fact that free atoms will absorb light at frequencies or wavelengths characteristic of the element of interest (hence the name atomic absorption spectrometry). Within certain limits, the amount of light absorbed can be linearly correlated to the concentration of analyte present. Free atoms of most elements can be produced from samples by the application of high temperatures. In GFAAS, samples are deposited in a small graphite tube, which can then be heated to vaporize and atomize the analyte. An ideal graphite furnace should fulfill the following requirements: A constant temperature in time and space during the interval in which free atoms are produced Quantitative atom formation regardless of the sample composition Separate control of the volatilization and atomization processes High sensitivity and good detection limits A minimum of spectral interferences Output Signal At a wavelength at which absorbance or fluorescence occurs, the transducer output rises to a maximum after a few seconds of ignition followed by a rapid decay back to zero as the atomization products escape into the surroundings. The change is rapid enough to require a high-speed data acquisition system. Quantitative analysis is usually based on peak height, although peak area also has been used. Performance Characteristics of Electrothermal Atomizers They offer the advantage of unusually high sensitivity for small volumes of sample. The relative precision of nonflame methods is generally in the range of 5% to 10% compared with the 1% or better that can be expected for flame or plasma atomization. Furthermore, furnace methods are slow- typically requiring several minutes per element. A final disadvantage is that the analytical range is low, being usually less than two orders of magnitude. Analysis of Solids with Electrothermal Atomizers A way of performing such measurements is to weigh the finely ground sample into a graphite boat and insert the boat manually in the furnace. Another way is to prepare a "slurry" of the powdered sample by ultrasonic agitation in an aqueous medium. The slurry is then pipetted into the furnace for atomization. Specialized Atomization Techniques Other atomization methods for sample introduction can be used for atomic absorption analyses. Three are described in this section. Glow Discharge Atomization A glow discharge device produces an atomized vapor that can be swept into a cell for absorption measurements. In order for this technique to be applicable, the sample must be an electrical conductor such as finely ground graphite or copper. Solution samples have also been analyzed by deposition on a graphite, aluminum, or copper cathode. Detection limits with this type of device are reported to be in the low parts per million for solid samples. Hydride Atomization Atomization of the hydrides requires only that they be heated in a quartz tube. Cold-Vapor Atomization This is applicable only to the determination of mercury because it is the only metallic element that has an appreciable vapor pressure at ambient temperature. This determination is of vital importance because of the toxicity of various organic mercury compounds and their widespread distribution in the environment. Detection limits in the parts-per-billion range are realized. Several manufacturers offer automatic instruments for performing this analysis for a variety of types of samples. B: Atomic Absorption Instrumentation Flame Atomic Absorption Spectroscopy Flame atomic absorption spectroscopy is currently the most widely used of all the atomic methods. It is so, because of its simplicity, effectiveness, and relatively low cost. The general use of this technique began in the early 1950s and grew explosively after that. The reason that atomic absorption methods were not widely used until that time was directly related to problems created by the very narrow widths of atomic absorption lines. The natural width of an atomic absorption or an atomic emission line is on the order of 10 -5 nm. Two effects, however, cause line widths to be broadened by a factor of 100 or more. Radiation Sources Analytical methods based on the atomic absorption are potentially highly specific because atomic absorption lines are remarkably narrow and because electronic transition energies are unique for each element. On the other hand, the limited line widths create a problem not ordinarily encountered in molecular absorption spectroscopy. The problem created by the limited width of atomic absorption peaks has been solved by the use of line sources with bandwidths even narrower than absorption peaks. Doppler Broadening Doppler broadening results from the rapid motion of atoms as they emit or absorb radiation. Atoms moving toward the detector emit wavelengths that are slightly shorter than the wavelengths by atoms moving at right angels to the detector. This difference is a manifestation of the well-known Doppler shift; the effect is reversed for atoms moving away from the detector. The net effect is an increase in the width of the emission line. For precisely the same reason, the Doppler effect also causes broadening of absorption lines. This type of broadening becomes more pronounced as the flame temperature increases because of the increased rate of motion of the atoms. Pressure Broadening Pressure broadening arises from collisions among atoms that cause slight variations in their ground state energies and slight energy differences between ground and excited states. Pressure broadening becomes greater with increases in temperature. So as result, broader absorption and emission peaks are always encountered at elevated temperatures. Hollow Cathode Lamps The most common source for atomic absorption measurements is the hollow cathode lamp. This type of lamp consists of a tungsten anode and a cylindrical cathode sealed in a glass tube that is filled with neon or argon at a pressure of 1 to 5 torr. The cathode is constructed of the metal whose spectrum is desired or serves to support a layer of that metal. The application of a potential of about 300 V across the electrodes causes ionization of the argon and generation of a current of 5 to 10 mA as the argon cations and electrons migrate to the two electrodes. If the potential is sufficiently large the argon cations strike the cathode with sufficient energy to dislodge some of the metal atoms and thereby produce an atomic cloud- and this process is called sputtering. The sputtered metal atoms in a lamp eventually diffuse back to the cathode surface of to the walls of the lamp and are deposited. The cylindrical configuration of the cathode tends to concentrate the radiation in a limited region of the metal tube; this design also enhances the probability that redeposition will occur at the cathode rather than on the glass wall. Electrodeless Discharge Lamps Electrodeless discharge lamps are useful sources of atomic line spectra and provide radiant intensities that are usually one to two orders of magnitude greater than their hollow cathode counterparts. A typical lamp is constructed from a sealed quartz tube containing an inert gas, such as argon, at a pressure of a few torr and a small quantity of the analyte metal. The lamp contains no electrode but instead is energized by an intense field of radio frequency or microwave radiation. The argon ionizes in this field and the ions are accelerated by the high frequency component of the field until they gain sufficient energy to excite the atoms of the metal whose spectrum is sought. Source Modulation In the typical atomic absorption instrument, it is necessary to eliminate interference caused by emission of radiation by the flame. Furthermore, most of it is removed by the monochromator. Nevertheless, emitted radiation corresponding in wavelength to the monochromator setting is inevitably present in the flame due to excitation and emission by analyte atoms. In order to eliminate the effects of flame emission it is necessary to modulate the output of the source so that its intensity fluctuates at a constant frequency. The detector then receives two types of signal, an alternative one from the source and a continuous one from the flame. Then these signals converted to the corresponding types of electrical response. A simple and entirely satisfactory way of modulating the emission from the source is to interpose a circular metal disk or c.4opper in the beam between the source and the flame. Alternate quadrants of this disk are removed to permit passage of light. Rotation of the disk at constant known rate provides a beam that is chopped to the desired frequency. Spectrophotometers Instruments for atomic absorption work are offered by numerous manufacturers; both single and double-beam designs are available. The range of sophistication and cost is substantial. In general, the instrument must contain: Narrow bandwidth to isolate the line chosen for measurement Sufficient glass filter Interchangeable interference filters Good-quality ultraviolet/visible monochromators Photomultiplier tubes Microcomputer systems that are used to control instrument parameters and data Single-Beam Instruments A typical single-beam instrument consists of several hollow cathode sources, a chopper or a pulsed power supply, an atomizer, and a simple grating spectrophotometer with a photomultiplier transducer. Double-Beam Instruments The beam of the hollow cathode is split by a mirrored chopper, one half passing through the flame and the other half around it. The two beams are then recombined by a halfsilvered mirror and passed into a Czerney-Turner grating monochromator; a photomultiplier tube serves as the transducer. The output from the latter is fed to a lockin amplifier that is synchronized with the chopper drive. The ratio between the reference and the sample signal is then amplified and fed to the readout, which may be a digital meter or a signal recorder. C: Interferences in Atomic Absorption Spectroscopy Spectral Interferences Spectral interferences arise when the absorption or emission of an interfering species either overlaps or lies so close to the analyte absorption or emission that resolution by the monochromator becomes impossible. The Two-Line Correction Method It employs a line from the source as a reference. The line should lie as close as possible to the analyte line but must not be absorbed by the analyte. If the conditions are met, it is assumed that any decrease in power of the reference line from that observed during calibration arises from absorption or scattering by the matrix products of the sample. The Continuum-Source Correction Method A deuterium lamp provides a source of continuous radiation throughout the ultraviolet region. The absorbance of the deuterium radiation is then subtracted from that of the analyte beam. The attenuation of the power of the continuum during passage through the atomized sample reflects only the broadband absorption or scattering by the sample matrix components. A background correction is thus achieved. Background Correction Based on the Zeeman Effect When an atomic vapor is exposed to a strong magnetic field a splitting of electronic energy levels of the atoms takes place that leads to formation of several absorption lines for each electronic transition. This phenomenon, which is called the Zeeman effect, is general for all atomic spectra. Application of the Zeeman effect to atomic absorption instruments is based upon the differing response of the two types of absorption peaks to polarized radiation. Zeeman effect instruments provide a more accurate correction for background than earlier methods. These instruments are particularly useful for electrothermal atomizers and permit the direct determination of elements in samples such as urine and blood. The decomposition of organic material in these samples leads to large background corrections and consequent susceptibility to significant error. Background Correction Based on the Source Self-Reversal The Smith-Hieftje background correction method is based upon the self-reversal or selfabsorption behavior of radiation emitted from hollow cathode lamps when they are operated at high currents. Chemical Interferences Chemical interferences result from various chemical processes occurring during atomization that alter the absorption characteristics of the analyte. They are more common than spectral ones. Their effects can frequently be minimized by a suitable choice of operating conditions. Both theoretical and experimental evidence suggest that many of the processes occurring in the mantle of a flame are in approximate equilibrium. As a consequence, it becomes possible to regard the burned gases as a solvent medium to which thermodynamic calculations can be applied. The equilibria of principle interest include: Formation of Compounds of Low Volatility Dissociation Reactions Ionization D: Atomic Absorption Analytical Techniques Sample Preparation It is required for flame spectroscopy that the sample be introduced into the excitation source in the form of a solution, most commonly an aqueous one. The decomposition and solution steps are often more time consuming and introduce more error than the spectroscopic measurement itself. Some common methods used for decomposition and dissolving samples for atomic absorption methods include treatment with hot mineral acids; oxidation with liquid reagents, such as sulfuric, nitric, or perchloric acids; combustion in an oxygen bomb or other closed container to avoid loss of analyte; ashing at a high temperature; and high-temperature fusion with reagents such as boric oxide, sodium carbonate, sodium peroxide, or potassium pyrosulfate. Table 1. EPA sample processing method for metallic element analysis Method Analysis Target Environmental Matrice Number total recoverable metals 3005 ground water/surface water dissolved metals 3005 ground water/surface water suspended metals 3005 ground water/surface water total metals 3010 aqueous samples, wastes that contain suspended solids and mobility-procedure extracts total metals 3015 aqueous samples, wastes that contain suspended solids and mobility-procedure extracts total metals 3020 aqueous samples, wastes that contain suspended solids and mobility-procedure extracts total metals 3050 sediments, sludges and soil samples total metals 3051 sludges, sediment, soil and oil Organic Solvents It was recognized that enhanced absorption peaks could be obtained from solutions containing low-molecular-weight alcohols, esters, or ketones. The effect of organic solvents is largely attributable to an increased nebulizer efficiency; the lower the surface tension of such solutions results in smaller drop sizes and a consequent increase in the amount of sample that reaches the flame. A most important analytical application of organic solvents to flame spectroscopy is the use of immiscible solvents such as methyl isobutyl ketone to extract chelates of metallic ions. The resulting extract is then nebulized directly into the flame. The sensitivity is increased not only by the enhancement of absorption peaks due to the solvent but also by the fact that for many systems only small volumes of the organic liquid are required to remove metal ions quantitatively from relatively large volumes of aqueous solution. Calibration Curves In theory, atomic absorption should follow Beer’s law with absorbance being directly proportional to concentration. However, departures from linearity are often encountered. A calibration curve that covers the range of concentrations found in the sample should be prepared. Any deviation of the standard from the original calibration curve can then be used to correct the analytical result. The idealized calibration or standard curve is stated by Beer's law that the absorbance of an absorbing analyte is proportional to its concentration. Standard Addition Method It is widely used in atomic absorption spectroscopy in order to partially or wholly counteract the chemical and spectral interferences introduced by the sample matrix. Techniques of Internal Standards Limitations of Internal Standard (IS) IS will be present in the atomization as the analyte is present and so the IS cannot be present in the sample to start with. It should be added to the sample, (If present in the original sample, IS should have a constant amount. In arc and/or spark methods, the IS should have the same comparable volatilization as the analyte. IS + analyte should have similar excitation energy IS+ analyte should have similar I.P.'s. Result: both analyte and IS give rise to similar intensities have similar intensities. Similar atomic weights, since diffusion depends upon weight. These six items are especially important when AES quantitative work is involved. Applications of Atomic Absorption Spectrometry Detection Limits Accuracy Instruments for the Flame Emission Spectroscopy Instruments for flame emission are ire similar in design to flame absorption instruments except that in the former the flame now acts as the radiation source, a hollow-cathode lamp and chopper axe therefore tin-necessary. E: Atomic Fluorescence Spectroscopy Instrumentation Sources A continuum source would be desirable for atomic fluorescence measurements. However, the output power of most continuum sources over a region as narrow as an atomic absorption line is so low as to restrict the sensitivity of the method severely. Hollow Cathode Lamp- only observed the fluorescent signal during pulses Electrodeless Discharge Lamp- produced intensities that exceed those of hollow cathode lamps; however, it is not available for many elements Lasers- ideal source with high intensities and narrow bandwidths; however, the high cost has discouraged their routine application Dispersive Instruments They are made up of a modulated source, an atomizer, a monochromator or an interference filter system, a detector, and a signal processor and readout. Nondispersive Instruments They ideally are made up of a source, an atomizer, and a detector. Advantages: Simplicity and low-cost instrumentation Ready adaptability to multi-element analysis High-energy throughput and thus high sensitivity Simultaneous collection of energy from multiple lines, enhancing sensitivity Interferences They appear to be of the same type and of about the same magnitude as those found in atomic absorption spectroscopy. Applications Atomic fluorescence methods have been applied to the analysis of metals in such materials as lubricating oils, seawater, biological substances, graphite, and agricultural samples. References www.anachemumu.se.htm www.aurora-instr.com/right.htm www.anachem.umu.se/jumpstation.htm www.anachem.umu.se/cgi/jumpstation.exe?AtomicSpectroscopy www.anachem.umu.se/cgi/jumpstation.exe?OpticalMolecularSpectroscopy www.minyos.its.rmit.edu.au/~rcmfa/mstheory.html http://science.widener.edu/sub/ftir/intro_it.html http://www.s-a-s.org/ http://www.chemsw.com http://www.scimedia.com/chem-ed/spec/atomic/aa.htm http://nercdg.org http://www.analyticon.com www.lcgmag.com/ www.lcms.com/ www.dq.fct.unl.pt/QOF/Chroma.html www-ssg.chem.utas.edu.au/ www.yahoo.com/science/chemistry/chromatography/ www.onlinegc.com http://www.scimedia.com/chem-ed/analytic/ac-meth.htm http://www.scimedia.com/chem-ed/spec/atomic/aa.htm http://www.scimedia.com/chem-ed/spec/atomic/afs.htm http://www.cee.vt.edu/program_areas/environmental/teach/smprimer/aa/aa.html#Features http://www.anachem.umu.se/aas/gfaas.htm http://www.agsci.ubc.ca/fnh/courses/food302/atomic/aatomic03.htm#electro http://www.scpscience.com/products/AA/hollowlamps.asp http://las.perkinelmer.com/catalog/Product.aspx?ProductId=N3050691 http://elchem.kaist.ac.kr/vt/chem-ed/spec/atomic/aa.htm
