IB Math SL 11 Unit 1 REVIEW Name Date The following diagram
advertisement

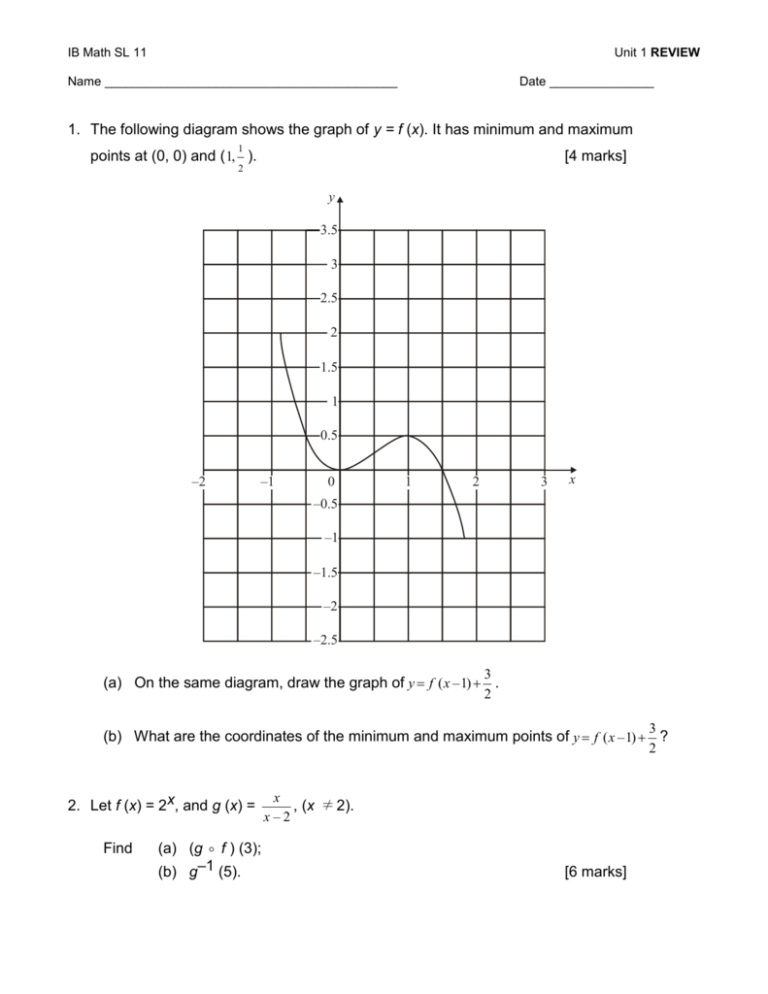
IB Math SL 11 Unit 1 REVIEW Name __________________________________________ Date _______________ 1. The following diagram shows the graph of y = f (x). It has minimum and maximum 1 points at (0, 0) and ( 1, ). [4 marks] 2 y 3.5 3 2.5 2 1.5 1 0.5 –2 –1 0 1 2 3 x –0.5 –1 –1.5 –2 –2.5 3 2 (a) On the same diagram, draw the graph of y f ( x – 1) . 3 2 (b) What are the coordinates of the minimum and maximum points of y f ( x – 1) ? 2. Let f (x) = 2x, and g (x) = Find (a) (g f ) (3); (b) g–1 (5). x , (x ≠ 2). x–2 [6 marks] IB Math SL 11 Unit 1 REVIEW 3. Consider the functions f : x 4(x – 1) and g : x (a) Find g–1. (b) Solve the equation ( f ° g–1) (x) = 4. 6– x . 2 [6 marks] 4. The graph of y = f (x) is shown in the diagram. (a) On each of the following diagrams draw the required graph, y 2 1 –2 –1 0 1 2 3 4 5 6 7 8 x 1 2 3 4 5 6 7 8 x 1 2 3 4 5 6 7 8 x –1 –2 (i) y = 2 f (x); y 2 1 –2 –1 0 –1 –2 (ii) y = f (x – 3). y 2 1 –2 –1 0 –1 –2 (b) The point A (3, –1) is on the graph of f. The point A’ is the corresponding point on the graph of y = –f (x) + 1. Find the coordinates of A’. [6 marks] IB Math SL 11 Unit 1 REVIEW 5. Consider the functions f (x) = 2x and g (x) = (a) Calculate (f ◦ g) (4). (b) Find g−1(x). (c) Write down the domain of g−1. 1 , x 3. x 3 [6 marks] 6. The graph of a function f is shown in the diagram below. The point A (–1, 1) is on the graph, and y = −1 is a horizontal asymptote. (a) Let g (x) = f (x −1) + 2. On the diagram, sketch the graph of g. (b) Write down the equation of the horizontal asymptote of g. (c) Let A′ be the point on the graph of g corresponding to point A. Write down the coordinates of A′. [6 marks] 7. Let f (x) = x3 − 4 and g (x) = 2x. (a) Find (g ◦ f ) (−2). (b) Find f −1 (x). [6 marks] IB Math SL 11 8. For each of the following relations state the domain and range. Unit 1 REVIEW