EECCA CSI 30- outlooks039 Specification - Freight
advertisement
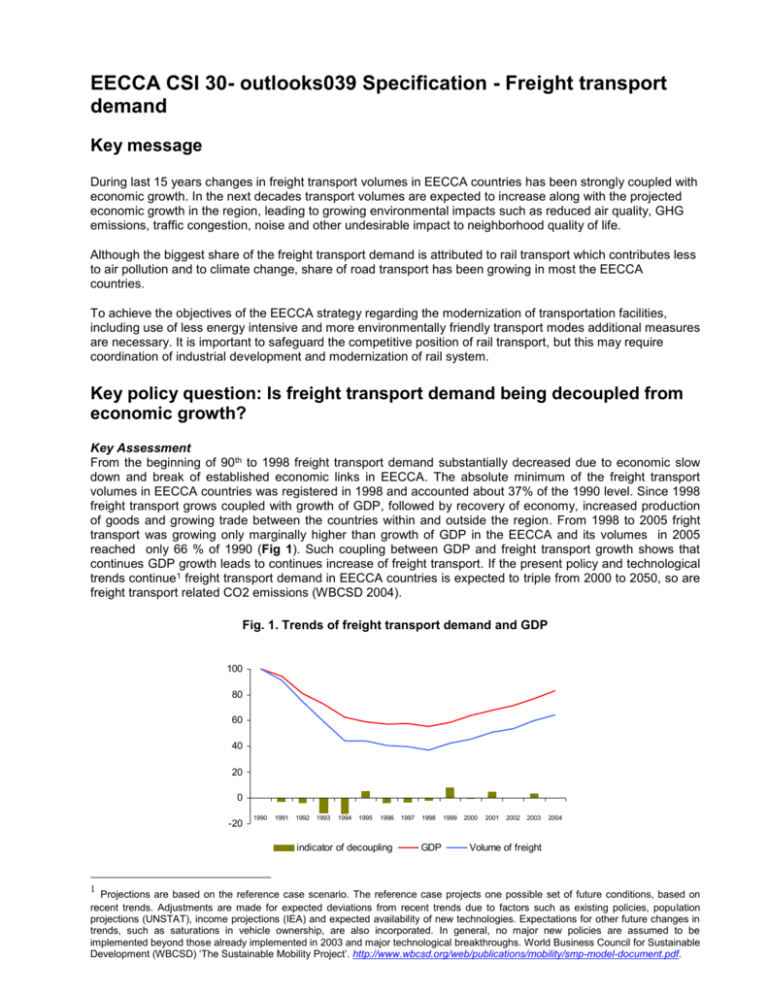
EECCA CSI 30- outlooks039 Specification - Freight transport demand Key message During last 15 years changes in freight transport volumes in EECCA countries has been strongly coupled with economic growth. In the next decades transport volumes are expected to increase along with the projected economic growth in the region, leading to growing environmental impacts such as reduced air quality, GHG emissions, traffic congestion, noise and other undesirable impact to neighborhood quality of life. Although the biggest share of the freight transport demand is attributed to rail transport which contributes less to air pollution and to climate change, share of road transport has been growing in most the EECCA countries. To achieve the objectives of the EECCA strategy regarding the modernization of transportation facilities, including use of less energy intensive and more environmentally friendly transport modes additional measures are necessary. It is important to safeguard the competitive position of rail transport, but this may require coordination of industrial development and modernization of rail system. Key policy question: Is freight transport demand being decoupled from economic growth? Key Assessment From the beginning of 90th to 1998 freight transport demand substantially decreased due to economic slow down and break of established economic links in EECCA. The absolute minimum of the freight transport volumes in EECCA countries was registered in 1998 and accounted about 37% of the 1990 level. Since 1998 freight transport grows coupled with growth of GDP, followed by recovery of economy, increased production of goods and growing trade between the countries within and outside the region. From 1998 to 2005 fright transport was growing only marginally higher than growth of GDP in the EECCA and its volumes in 2005 reached only 66 % of 1990 (Fig 1). Such coupling between GDP and freight transport growth shows that continues GDP growth leads to continues increase of freight transport. If the present policy and technological trends continue1 freight transport demand in EECCA countries is expected to triple from 2000 to 2050, so are freight transport related CO2 emissions (WBCSD 2004). Fig. 1. Trends of freight transport demand and GDP 100 80 60 40 20 0 -20 1990 1991 1992 1993 1994 1995 1996 indicator of decoupling 1 1997 1998 GDP 1999 2000 2001 2002 2003 2004 Volume of freight Projections are based on the reference case scenario. The reference case projects one possible set of future conditions, based on recent trends. Adjustments are made for expected deviations from recent trends due to factors such as existing policies, population projections (UNSTAT), income projections (IEA) and expected availability of new technologies. Expectations for other future changes in trends, such as saturations in vehicle ownership, are also incorporated. In general, no major new policies are assumed to be implemented beyond those already implemented in 2003 and major technological breakthroughs. World Business Council for Sustainable Development (WBCSD) ‘The Sustainable Mobility Project’. http://www.wbcsd.org/web/publications/mobility/smp-model-document.pdf. Y – Index 1990 = 100 Although the general trends are similar across the region there are substantial differences in freight transport volumes and intensities between the countries (Fig. 2, Fig 3). This reflects structure of countries’ economies and transport infrastructure. For instance, in the countries with the higher freight transport intensity (Kazakhstan, Russia and Ukraine) bigger part of the economies is extraction and heavy industries. These countries also have bigger territories and have a higher demand of transportation of a large amount of raw materials and goods. Countries with the low transport intensity (Armenia, Azerbaijan, Kyrgyzstan, Georgia, Moldova) have less developed industrial activities and/or more service oriented economies. These countries also have smaller territory and transportation distances of goods inside the country are much smaller. Fig. 2. Fright transport demand by countries Fig. 3. Freight transport annual intensities for selected years 4000000 18000,0 3500000 15000,0 tkm/ 1000 USD (2000) mln tonne-km 4500000 3000000 2500000 2000000 1500000 12000,0 9000,0 6000,0 3000,0 0,0 EE CC A1 0 Ka za khs tan Ru ss i a Uk rai ne Be lar us Mo ldo va Ge o rg ia Az er b aija n Ta jiki s ta n Ky r gy z st an Arm en ia 1000000 500000 Other EECCA Kazakhstan Ukraine 2004 2003 2002 2001 2000 1999 1998 1997 1996 1995 1994 1993 1992 1991 1990 0 1990 1998 2005 Russia Specific policy question Is there in EECCA countries a trend of reduction of the percentage of goods transported by road relative to other modes? From 1990 to 2005 there is a slight change in modal split of freight transport demand in EECCA region. Rail transport share is stable during the considered period and significantly exceeds other types of transport in EECCA countries (92% in 2005 for EECCA region) (Fig. 4). Share of road transport slowly increases (less than 10% from 1991 to 2005). The share of the inland water transport is insignificant but decreased from 0.006 % in 1991 and 0.003% in 2005. Fig. 4. Modal split trends of freight transport demand in EECCA (%) inland water rail road, inland 100% 90% 80% 70% 60% 50% 40% 30% 20% 10% 0% 1991 1995 2000 2005 Detailed assessment of modal split uncovers substantial differences in modal split and modal shift in different countries of the region. (Fig.5). In most of the countries rail dominates in fright transport. Russia the share of rail has the highest level among EECCA countries (90% in 1990 and 94% in 2005) since its economy is based on the extraction and heavy manufacturing industries, which are spread in a large territory leading to transportation of heavy goods to a large territory. Coal, fossil materials, metal, cement, construction materials, wood and machineries constitute more than 80% of freight In Russia in 2005. Rail transport also grows in Armenia and Georgia. In all other EECCA countries rail decreases and road transport increases substantially reflecting changes in economic structures, types of good transported2 and infrastructure modifications. In 2005 the highest share of road transport among EECCA countries was in Kyrgyzstan (48%), followed by Azerbaijan (44 %) and Tajikistan (43%). In these countries road vehicles with their high flexibility and mobility have greater importance for transportation of goods than rail due to the mountains nature landscapes and economic restructuring. Increase of economical relations between Western Europe and other EECCA countries might be another reason for growth of road transport shares in countries with transition location, Ukraine, Moldova and Belarus. Western Europe modern production prefers 'just-in-time' delivery of goods. Transport speed and flexibility are therefore of great importance there and despite congestion; road transport is often faster and more flexible than rail or water transport. While international trade and international economic cooperation in EECCA increases, share of road transport keeps growing. Fig. 5 Modal split of freight transport demand in some EECCA countries (%) 100% 80% 60% 40% 20% Armenia Azerbaijan Georgia Kazakhstan Kyrgyzstan inland water rail Tajikistan Moldova Russia Ukraine 19 9 19 1 9 20 5 0 20 0 05 19 9 19 0 9 20 5 0 20 0 05 19 9 19 0 9 20 5 0 20 0 05 19 9 19 0 9 20 5 0 20 0 05 19 9 19 1 9 20 5 0 20 0 05 19 9 19 0 9 20 5 0 20 0 05 19 9 19 0 9 20 5 0 20 0 05 19 9 19 0 9 20 5 0 20 0 05 19 9 19 0 9 20 5 0 20 0 05 19 9 19 0 9 20 5 0 20 0 05 0% Belarus road, inland If these trends continue the transport related CO2 emissions in most EECCA countries will rise much faster than in previous years contributing more to Climate Change. Other adverse effects of the freight transport such as air pollution, traffic congestion and noise will also increasingly affect environment and quality of life. According to the UNECE guidelines the total freight transport demand and in the modal split should include Pipe lines. Due to the lack of data in time series 1990 – 2005 pipelines were not included. However, it was possible to show the trends in pipelines developments from 2000 to 2005 for some countries (Fig. 5). Russia experienced the biggest increased in pipelines transport (45% from 2000 to 2005), Ukraine 5%, other EECCA countries all together 29%. 2 ** Perishable and high-value goods require fast and reliable transportation - road transport is often the fastest and most reliable form available, providing much flexibility with pickup and delivery points. To make this analysis more comprehensive it would be necessary to look at the changes of the types of goods transported, however this statistics was not available for all the countries at the time this assessment was made and this statement is a hypothesis of the assessment team. If the countries have some information we would appreciate it. mln. Tonne-kn 3000000 2500000 2000000 1500000 1000000 500000 0 2000 2001 AR, Az, KR, BE, KA 2002 2003 Ukraine 2004 2005 Russian Federation The current trends show that increase in pipelines has a linear correspondence with the increase of the air population from its operation. For example in Russia from 2004 to 2005 pipelines increased on 4,3 %, similar increase of 4% is registered fro air pollutions from pipelines (SoE, Russia federation, 2005). Additional measures for more sustainable pipelines operations is needed to reduce the air pollutions, prevent accidents and reduce financial and environmental losses related to such accidents. Recommendation: EECCA countries are still in the process of re-structuring their economic and political structures and have a big opportunity to make their development more sustainable already at this stage. Some measures, including modernization of transportation facilities and use of less energy intensive and more environmentally friendly transport outlined in EECCA environmental strategy can be taken by countries. It is also important to safeguard the competitive position of rail transport, but this may require coordination of industrial development and modernization of rail system. Methodology for indicator calculation How did we create this indicator? The indicator is calculated according to the UNECE Guidelines for the Application of Environmental Indicators in Eastern Europe, Caucasus and Central Asia for EECCA countries (http://www.unece.org/env/europe/monitoring/Belgrade/CRP1.Indicators.En%20edited.MK..pdf). However some modifications were made due to regional analysis needs and data availability. These are presented below. To measure relation of freight transport demand from economic growth, separate trends of the volume of freight transport relative and growth of GDP (i.e. the intensity) are calculated. The trends for its two components are shown for the EECCA countries and sub-regions (Eastern Europe, Caucasus and Central Asia). Freight transport demand and GDP are shown as an index (1990=100). The ratio of the former to the latter is indexed on the previous year (i.e. annual decoupling/intensity changes) in order to be able to observe changes in the annual intensity of freight transport demand relative to economic growth. The indicator freight transport intensity is defined as the ratio between freight transport demand in tkm and GDP in constant 2000 prices (in both the national currency and the US dollar equivalent). The indicator of modal split is presented as a share of particular mode of transport in total freight transport demand (i.e. the modal split share for freight transport). Although the methodology demands to include pipelines, due to the lack of the data for timeseries from 1990 to 2005 it was excluded from all the calculations of fright transport demand, transport intensity and modal split. A separate graph presenting pipelines trends from 2000 to 2005 was presented to eliminate this drawback. Time period: 1990 - 2005 Units: tonne-kilometre Data source: Interstate Statistical Committee of the Commonwealth of Independent States. ’15 years of the Commonwealth Independent States’. CD published 2006-11. GDP - World Bank When the data was not available the gaps were filled from other sources as presented in the table below: Country Belarus Missing timeseries 1998, 1999, 2000 Tajikistan 2005 Proposed gap filling Commonwealth of Independent States in 2004. Statistical Yearbook. Interstate Statistical Committee of the Commonwealth of Independent States, Moscow, 2005, р. 243 Commonwealth of Independent States in 2005. Statistical Yearbook. Interstate Statistical Committee of the Commonwealth of Independent States, Moscow, 2006, р. 504


