期中 畢業
advertisement
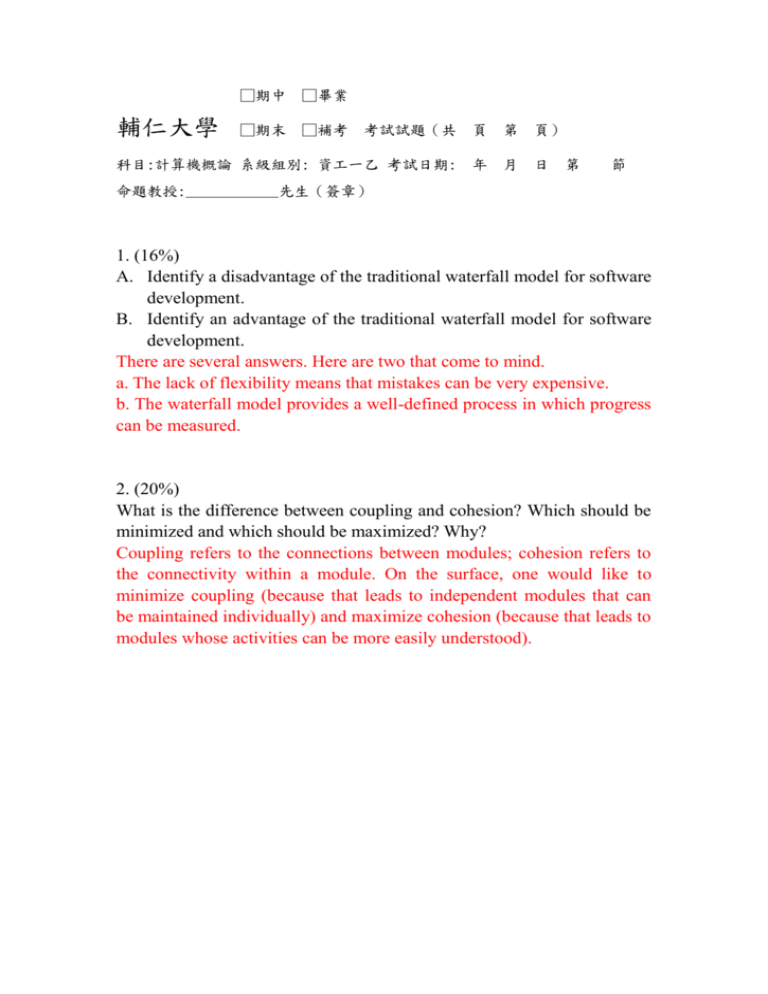
輔仁大學 □期中 □畢業 □期末 □補考 考試試題(共 頁 第 頁) 科目:計算機概論 系級組別: 資工一乙 考試日期: 年 月 日 第 節 命題教授:____________先生(簽章) 1. (16%) A. Identify a disadvantage of the traditional waterfall model for software development. B. Identify an advantage of the traditional waterfall model for software development. There are several answers. Here are two that come to mind. a. The lack of flexibility means that mistakes can be very expensive. b. The waterfall model provides a well-defined process in which progress can be measured. 2. (20%) What is the difference between coupling and cohesion? Which should be minimized and which should be maximized? Why? Coupling refers to the connections between modules; cohesion refers to the connectivity within a module. On the surface, one would like to minimize coupling (because that leads to independent modules that can be maintained individually) and maximize cohesion (because that leads to modules whose activities can be more easily understood). 3. (24%) Answer the following questions in relation to the accompanying structure chart: a. To which module does module Y return control? b. To which module does module Z return control? c. Are modules W and X linked via control coupling? d. Are modules W and X linked via data coupling? e. What data is shared by both module W and module Y? f. In what way are modules Y and X related? a. W b. W if W called it, X if X called it. c. no d. yes, through the common use of data element a. e. element a. f. data coupling through data element a. 4. (10%) What is UML? UML is a standard for representing object-oriented designs. 5. (15%) Draw a simple dataflow diagram depicting the flow of data that occurs in an automated inventory system when a sale is made. Answers will vary. The important thing is that the students focus on the flow of data. One answer would be a diagram showing an “inventory record” being retrieved from the “inventory database” and merging with a “sales record” to form an “updated inventory record,” which flows back to the “inventory database.” 6. (15%) Draw a class diagram representing the relationships between the servers and customers in a restaurant. Ans:
