Supplementary Material (doc 382K)
advertisement
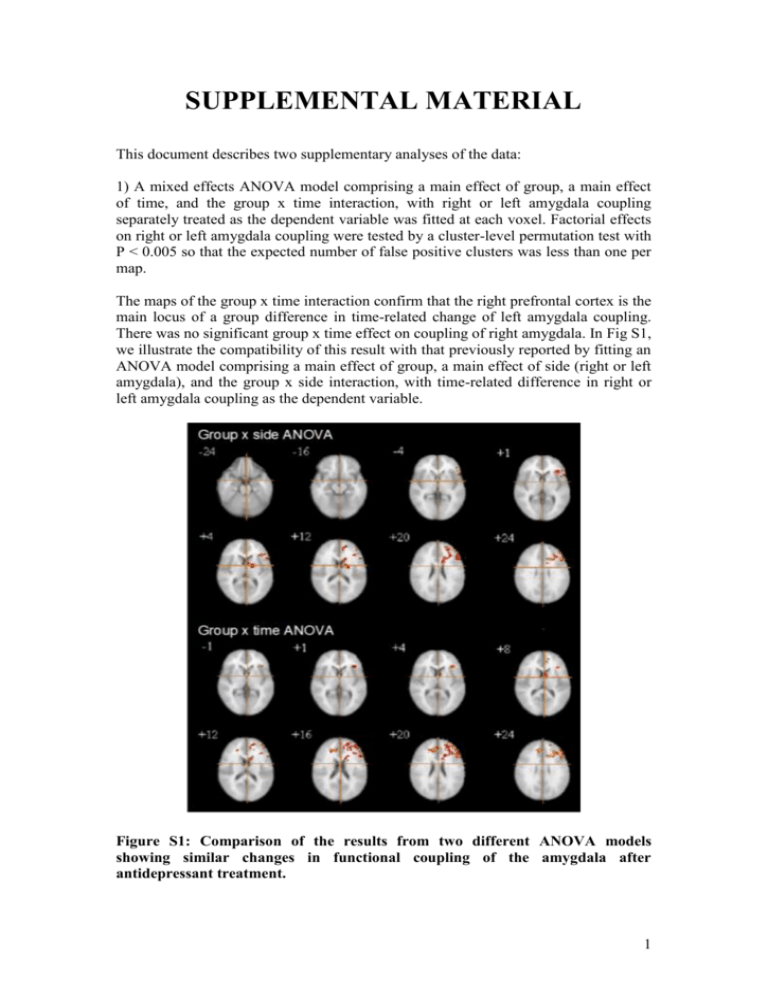
SUPPLEMENTAL MATERIAL This document describes two supplementary analyses of the data: 1) A mixed effects ANOVA model comprising a main effect of group, a main effect of time, and the group x time interaction, with right or left amygdala coupling separately treated as the dependent variable was fitted at each voxel. Factorial effects on right or left amygdala coupling were tested by a cluster-level permutation test with P < 0.005 so that the expected number of false positive clusters was less than one per map. The maps of the group x time interaction confirm that the right prefrontal cortex is the main locus of a group difference in time-related change of left amygdala coupling. There was no significant group x time effect on coupling of right amygdala. In Fig S1, we illustrate the compatibility of this result with that previously reported by fitting an ANOVA model comprising a main effect of group, a main effect of side (right or left amygdala), and the group x side interaction, with time-related difference in right or left amygdala coupling as the dependent variable. Figure S1: Comparison of the results from two different ANOVA models showing similar changes in functional coupling of the amygdala after antidepressant treatment. 1 Top panel: ANOVA maps shown in the main text (see Figure 2) based on a group x side ANOVA model that was specified to include a main effect of group (with 2 levels: control and depressed groups), a main effect of side (with 2 levels: left and right amygdala), and a group x side interaction. The dependent variable is the value of functional coupling of the amygdala at week 0 subtracted from the value at week 8 (see Methods). These two rows show the anatomical locations of a main effect of group on time-related change in amygdala coupling. A significantly greater timerelated increase in functional coupling of the left amygdala to these regions (e.g., right prefrontal and anterior cingulate cortex) was shown in depressed patients treated with antidepressant medication over the course of 8 weeks. Bottom panel: ANOVA maps based on a group x time ANOVA model that was specified to include a main effect of group (with 2 levels: control and depressed groups), a main effect of time (with 2 levels: week 0 and week 8), and a group by time interaction. This model was separately fit for left and right amygdale coefficients at each voxel. There was a significant group x time interaction in the right caudate, right insula, bilateral middle frontal cortex, right superior frontal gyrus, and midcingulate. These regions showed increased functional coupling with the left amygdala in depressed patients after treatment. There was no significant interaction for the right amygdala. Results from both models are consistent with the hypothesis that antidepressant treatment was associated with significantly increased coupling between right frontal regions and (specifically) left amygdala. 2) Direct between-group comparisons, by independent t-tests, of right or left amygdala coupling at week 0 and week 8. Loci of significant differences were identified by means of a cluster-level permutation test identical to the method used in the ANOVA analysis (see Methods). Functional coupling of the left amygdala was decreased in depressed patients compared to matched healthy controls at baseline in hippocampus, contralateral amygdala, putamen, insula, parahippocampus, inferior, middle and superior temporal cortices, inferior and middle frontal cortices. Functional coupling of the right amygdala was decreased in depressed patients compared to healthy controls at baseline in hippocampus, contralateral amygdala, putamen, insula, parahippocampus, inferior, middle and superior temporal cortices, inferior and middle frontal cortices, lingual gyrus, fusiform gyrus and cerebellum. No regions showed greater functional coupling of the bilateral amygdala in depressed patients compared to healthy controls at baseline. There was no significant difference between depressed and control groups in functional coupling of the amygdala after treatment. 2 Figure S2: Functional coupling of the right and left amygdala was significantly decreased (blue voxels) in depressed patients compared to healthy controls before treatment (week 0). There were no loci of significant between-group difference in amygdala coupling at week 8, suggesting that antidepressant treatment normalises functional coupling of the amygdala in patients. Supplementary information is available at the Neuropsychopharmacology website 3
