Uniform and non-uniform acceleration
advertisement
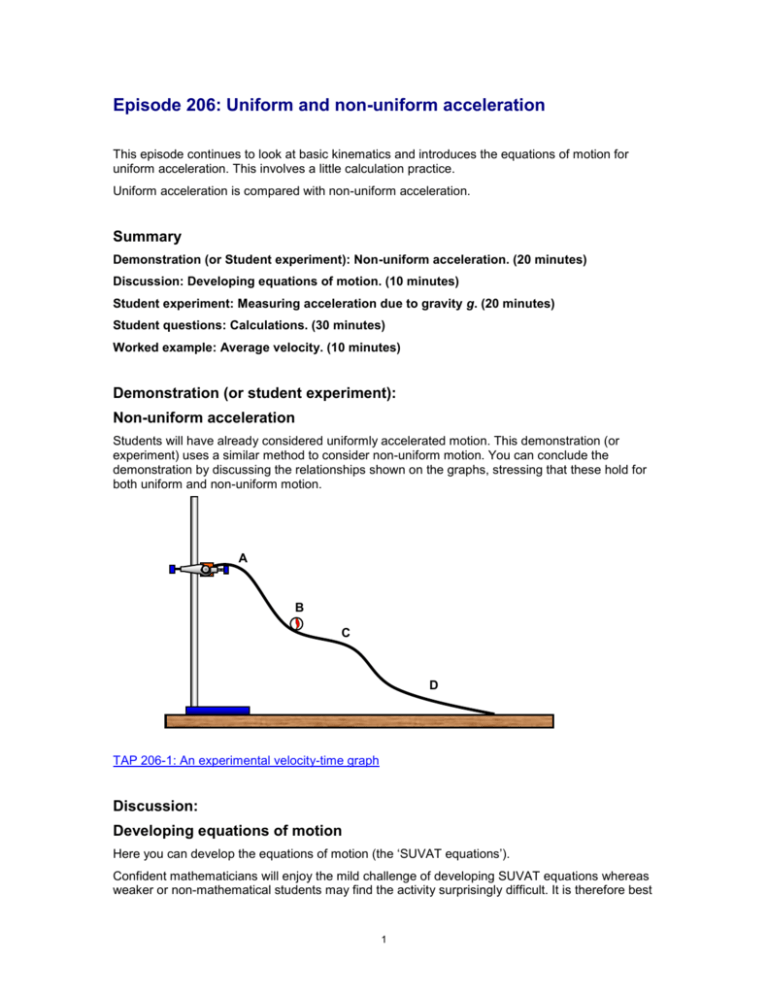
Episode 206: Uniform and non-uniform acceleration This episode continues to look at basic kinematics and introduces the equations of motion for uniform acceleration. This involves a little calculation practice. Uniform acceleration is compared with non-uniform acceleration. Summary Demonstration (or Student experiment): Non-uniform acceleration. (20 minutes) Discussion: Developing equations of motion. (10 minutes) Student experiment: Measuring acceleration due to gravity g. (20 minutes) Student questions: Calculations. (30 minutes) Worked example: Average velocity. (10 minutes) Demonstration (or student experiment): Non-uniform acceleration Students will have already considered uniformly accelerated motion. This demonstration (or experiment) uses a similar method to consider non-uniform motion. You can conclude the demonstration by discussing the relationships shown on the graphs, stressing that these hold for both uniform and non-uniform motion. A B C D TAP 206-1: An experimental velocity-time graph Discussion: Developing equations of motion Here you can develop the equations of motion (the ‘SUVAT equations’). Confident mathematicians will enjoy the mild challenge of developing SUVAT equations whereas weaker or non-mathematical students may find the activity surprisingly difficult. It is therefore best 1 to proceed through the activity at a reasonable pace so that you concentrate on the results and using the SUVAT equations. TAP 206-2: Deriving the equations of motion Student experiment: Measuring acceleration due to gravity g Measuring the acceleration due to gravity g is a nice, simple experiment that also brings up the concepts of precision and accuracy. Of course, the students will ‘know’ the value of g, and may well have measured it. Nonetheless, it is a useful exercise to build good experimental practice. TAP 206-3: Measuring the acceleration of free fall Student questions: Calculations These are a few simple questions that go over the ideas met in the unit. They include practice with interpreting motion graphs. TAP 206-4: Motion under gravity TAP 206-5: Thrust SSC Worked example: Average velocity You might like to use the question below to highlight that the equations of motion (SUVAT equations) only apply to uniform acceleration. A cyclist travels a displacement of 300 m due North at a velocity of 10 m s-1. She travels the next 300 m in the same direction at a velocity of 15 m s-1. Calculate the average velocity of the cyclist. Answer: 1st 300 m takes: 300/10 = 30 s 2nd 300 m takes: 300/15 = 20 s average velocity = total displacement/ total time = 600 / 50 = 12 m s-1. Many weaker pupils will assume the answer is 12.5 m s -1. You will have to explain why the equation: average velocity = (v + u) / 2 cannot be used in this example. The equation only applies to uniformly accelerated motion. The cyclist spends longer travelling at 10 m s -1 than at 15 m s-1. 2 TAP 206- 1: An experimental velocity-time graph Apparatus bendy track (about 1 – 1.5 m length) retort stands and clamps tape measure suitable ‘vehicle’ e.g. marble sensing software data logging software (e.g. Insight) + computer stopwatch Set up the sensing apparatus to give velocity readings. If you are using a marble/ball bearing as a vehicle you must ensure that it passes through the beam at its greatest diameter. Bend the track into a suitably non-uniform slope. This may require a few lab stands. A B C D Position the light gate at a chosen position A. Measure the distance from release point along the track to point A using a tape measure. Measure the time taken for the vehicle to reach position A when released from rest at the top of the slope. Record the mean value of the time in a suitable table. (Excel can be used to speed the analysis up.) Use the software to determine the speed of the vehicle as it passes through point A. Repeat the process for other points along the track to obtain a table of results with the following headings: position distance along track /m time taken to reach position / s Try to get as many measurement points as possible. 3 velocity at position / m s-1 Analysis Plot velocity-time and distance-time graphs of the results. Measure the area under the velocity-graph – this should approximate to the length of the track to the last point. Draw a tangent to the line at a suitable point on the distance–time graph. The gradient will yield the velocity which can be compared to the velocity-time graph. 4 TAP 206- 2: Deriving the equations of motion Look at the graph of motion with uniform acceleration. By finding the area under this graph we can derive another useful equation for uniformly accelerated motion – because the area under a velocity–time graph is equal to the displacement: area of rectangle = initial velocity × time interval area of rectangle = ut area of triangle = ½ × base × height area of triangle = ½ t × (v - u) = a t so area of triangle = ½ a t2 and displacement = area of rectangle + area of triangle = ut + ½ a t2 You know that: (v – u) s 5 Usually you will see this equation written using just t (not t) to represent the overall time taken and s to represent the overall displacement: s = ut + ½ at2 Use the equations that have you already met to show that: v2 = u2 + 2as 6 Practical advice For many students, this might be the first time they have encountered the idea of a tangent to a graph, and the idea of a gradient. Make sure that they appreciate that drawing a tangent and finding its gradient is equivalent to calculating x/t (or v/t) using a very small time interval. You may need to explain the ‘delta’ notation to some students. They could do likewise with graphs generated by Multimedia Motion. (Multimedia Motion in fact does not simply measure the change in one time interval, but uses a more sophisticated technique using the data points either side, so the graphs generated by the software will not be quite the same as those generated by hand.) External references This activity is taken from Salters Horners Advanced Physics, Section HFS, Additional Activity 6 7 TAP 206- 3: Measuring the acceleration of free fall Getting as close to g as possible In this activity you are required to measure the acceleration of free fall as accurately as possible, given the limitations of the apparatus used. You should also estimate the degree of uncertainty in your final result. You will need access to a reasonably large 'drop', e.g. a stair well. ball bearing cardboard box with cloths, or some other arrangement, to ensure a soft, safe landing tape measure stopwatch reading to at least 0.1 s Plus – if available (and there is enough time to use it) an electronic timing system, data-logging device, video camera or computeraided system for measuring the time of fall through a measured distance What to do 1. Start with the simplest possible equipment listed above and use it to time the fall of a small metal sphere through a measured height. Calculate the value of the sphere's acceleration – hopefully close enough to be labelled g – using the formula: s 21 gt 2 where t is the time of fall and s the distance fallen. 2. Repeat the readings 10 times and consider the results. Decide if any are too different from the others to be considered unreliable. If you have a reason why a result is wrong (e.g. you know you started the stopwatch too late) then discard it and take enough extra, reliable measurements to make up the total to 10. 3. Take the mean of these as your measurement of g. 4. Estimate the possible spread of values in each of your measurements. 5. Now use these estimates to calculate the worst possible cases. What are the largest and smallest values of g that your measurements and uncertainties could allow? (Hint – perform two separate calculations.) 6. Now estimate how precisely you have measured the value of g. 7. Think about whether there could be bias in your experiment, giving a value which is systematically too high to too low. Extra You might have the time and interest to try to make a more reliable estimate of g. A number of electronic and other types of equipment have been designed for this. Check with your teacher 8 whether or not such equipment to measure g is available and worth using. After all, the best way to find out the value of g is to look it up in a book of physical constants. Points to learn from this: 1. One or two ways for measuring the acceleration of free fall. 2. How to estimate the reliability of a measurement and quantities calculated from measurements. 9 Practical advice This activity is somewhat open-ended, allowing students to engage in simple measurements and then think about what to improve, and how. Alternative approaches The same procedure may be used with a digital stop clock or timer instead of the computer and interface. The data could be entered into a spreadsheet and manipulated to calculate speeds and plot graphs. The method described removes the hassle of entering much of the data. External references This activity is taken from Advancing Physics Chapter 9, 120E 10 TAP 206- 4: Motion under gravity Questions 1-3 are about free fall. Use the approximation g = 10 m s-1. 1) In the first part of a bungee jump, before the cord starts to stretch, the jumper is in free fall. Calculate the vertical displacement of a bungee jumper at 1.0 s, 2.0 s, 3.0 s, 4.0 s and 5.0 s after starting from rest. 2) Calculate the times taken for a bungee jumper to fall 1.25 m, 4 1.25 m, 9 1.25 m and 16 1.25 m from rest. Comment on your answers. 3) The diagram below shows a simple reaction timer. The idea is that, as the ruler is released, a buzzer sounds. At the sound of the buzzer, the person traps the ruler with their foot (rather like braking in a car). The distance that the ruler falls indicates the person’s reaction time. Work out how the markings should be spaced if the timer is to be calibrated (marked) with times 0.1 s, 0.2 s, 0.3 s, etc. 11 Answers and worked solutions 1) s = ut + ½ at2 u = 0 so s = + ½ at2 a = g = 10 m s-2 so s = 5t2 s = 5 x 1 x1 = 5 m 2) Time / s 1.0 2.0 3.0 4.0 5.0 Distance / m 5 20 45 80 125 s = + ½ at2 a = g = 10 m s-2 for 1.25 m, s = + ½ at2 1.25 = 5t2 so 1.25/5 = t2 so t2 = 0.25 and t = 0.5 s Distance /m 1.25 4 x 1.25 9 x 1.25 16 x 1.25 Time / s 0.5 1.0 1.5 2 When time doubled distance goes up 4 times (Note the displacement s and g are both in the same direction and if vertically upwards is taken to be positive they should both have – signs.) 80 cm 0.4 s 45 cm 0.3 s 20 cm 0.2 s 11.3 cm 0.15 s 5 cm 0.1s 3) s = + ½ at2 a = g = 10 m s-2 For 0.1 s then s =½ 10 (0.1)2 = 5 x 0.1 x 0.1 = 0.05 m = 5 cm For 0.2 s then s =½ 10 (0.2)2 = 5 x 0.2 x 0.2 = 0.2 m = 20 cm For 0.3 s then s =½ 10 (0.3)2 = 5 x 0.3 x 0.3 = 0.45 m = 45 cm For 0.4 s then s =½ 10 (0.4)2 = 5 x 0.4 x 0.4 = 0.8 m = 80 cm Note that 0.15 seconds is not exactly half way between 5 cm and 20 cm, consider if this is important error wise. For 0.15 s then s =½ 10 (0.15)2 = 5 x 0.51 x 0.15 = 0.1125 m = 11.25 cm (11.3 cm). External references This activity is taken from Salters Horners Advanced Physics, AS, Section Higher, Faster, Stronger, HFS, Additional Activity 6 12 TAP 206- 5: Thrust SSC 1. In 1997 Thrust SSC was driven to a supersonic world record speed of 771 mph (peak) and 767 mph (mile average) (about 334 m s-1and 332 m s-1). Thrust SSC In their research the Thrust SSC Development Team predicted that the car’s velocity would initially increase as shown in the graph below. (a) Describe in words only (no numerical values) the predicted acceleration (i) during the first 4 seconds, (ii) from 4 s to 30 s. (b) Use the graph to predict the size of the acceleration at 12 s. (c) Use the same graph to predict the car’s displacement after 10 s. 13 Answers and worked solutions 1 (a) (i) (ii) Uniform acceleration Non-uniform acceleration After 4 s, acceleration first increases (slightly) then decreases. (NB NO deceleration, acceleration does NOT become negative) (b) a = v/t = 180 m s-1/10 s (or similar values read from tangent to graph) = 18.0 m s-1 (c) 100 small squares represent 1000 m area under graph is about 62 small squares so displacement is about 1000 m x 62/100 = 620 m (or similar value deduced from area of graph) External references This activity is taken from Salters Horners Advanced Physics, AS, Section Higher, Faster, Stronger, HFS, Additional Activity 6. 14
