Syllabus for the Second 9 Weeks
advertisement

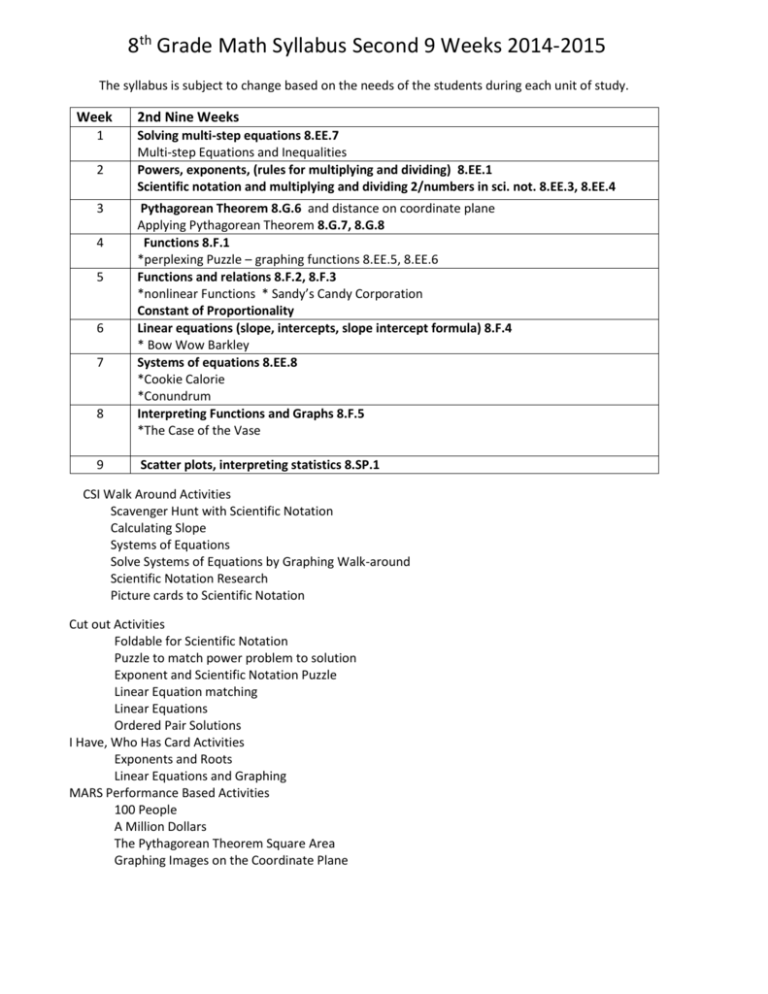
8th Grade Math Syllabus Second 9 Weeks 2014-2015 The syllabus is subject to change based on the needs of the students during each unit of study. Week 1 2 3 4 5 6 7 8 9 2nd Nine Weeks Solving multi-step equations 8.EE.7 Multi-step Equations and Inequalities Powers, exponents, (rules for multiplying and dividing) 8.EE.1 Scientific notation and multiplying and dividing 2/numbers in sci. not. 8.EE.3, 8.EE.4 Pythagorean Theorem 8.G.6 and distance on coordinate plane Applying Pythagorean Theorem 8.G.7, 8.G.8 Functions 8.F.1 *perplexing Puzzle – graphing functions 8.EE.5, 8.EE.6 Functions and relations 8.F.2, 8.F.3 *nonlinear Functions * Sandy’s Candy Corporation Constant of Proportionality Linear equations (slope, intercepts, slope intercept formula) 8.F.4 * Bow Wow Barkley Systems of equations 8.EE.8 *Cookie Calorie *Conundrum Interpreting Functions and Graphs 8.F.5 *The Case of the Vase Scatter plots, interpreting statistics 8.SP.1 CSI Walk Around Activities Scavenger Hunt with Scientific Notation Calculating Slope Systems of Equations Solve Systems of Equations by Graphing Walk-around Scientific Notation Research Picture cards to Scientific Notation Cut out Activities Foldable for Scientific Notation Puzzle to match power problem to solution Exponent and Scientific Notation Puzzle Linear Equation matching Linear Equations Ordered Pair Solutions I Have, Who Has Card Activities Exponents and Roots Linear Equations and Graphing MARS Performance Based Activities 100 People A Million Dollars The Pythagorean Theorem Square Area Graphing Images on the Coordinate Plane Expressions and Equations 8.EE Work with radicals and integer exponents. 1. Know and apply the properties of integer exponents to generate equivalent numerical expressions. 3. Use numbers expressed in the form of a single digit times an integer power of 10 to estimate very large or very small quantities, and to express how many times as much one is than the other. 4. Perform operations with numbers expressed in scientific notation, including problems where both decimal and scientific notation are used. Use scientific notation and choose units of appropriate size for measurements of very large or very small quantities (e.g., use millimeters per year for seafloor spreading). Interpret scientific notation that has been generated by technology. Analyze and solve linear equations and pairs of simultaneous linear equations. 7. Solve linear equations in one variable. a. Give examples of linear equations in one variable with one solution, infinitely many solutions, or no solutions. Show which of these possibilities is the case by successively transforming the given equation into simpler forms, until an equivalent equation of the form x = a, a = a, or a = b results (where a and b are different numbers). b. Solve linear equations with rational number coefficients, including equations whose solutions require expanding expressions using the distributive property and collecting like terms. Geometry 8.G Understand and apply the Pythagorean Theorem. 6. Explain a proof of the Pythagorean Theorem and its converse. 7. Apply the Pythagorean Theorem to determine unknown side lengths in right triangles in real-world and mathematical problems in two and three dimensions. 8. Apply the Pythagorean Theorem to find the distance between two points in a coordinate system. Functions 8.F Define, evaluate, and compare functions. 1. Understand that a function is a rule that assigns to each input exactly one output. The graph of a function is the set of ordered pairs consisting of an input and the corresponding output. 2. Compare properties of two functions each represented in a different way (algebraically, graphically, numerically in tables, or by verbal descriptions). 3. Interpret the equation y = mx + b as defining a linear function, whose graph is a straight line; give examples of functions that are not linear. 4. Construct a function to model a linear relationship between two quantities. Determine the rate of change and initial value of the function from a description of a relationship or from two (x, y) values, including reading these from a table or from a graph. Interpret the rate of change and initial value of a linear function in terms of the situation it models, and in terms of its graph or a table of values. 5. Describe qualitatively the functional relationship between two quantities by analyzing a graph (e.g., where the function is increasing or decreasing, linear or nonlinear). Sketch a graph that exhibits the qualitative features of a function that has been described verbally. Statistics and Probability 8.SP Investigate patterns of association in bivariate data. 1. Construct and interpret scatter plots for bivariate measurement data to investigate patterns of association between two quantities. Describe patterns such as clustering, outliers, positive or negative association, linear association, and nonlinear association.


