Inverse Variation
advertisement
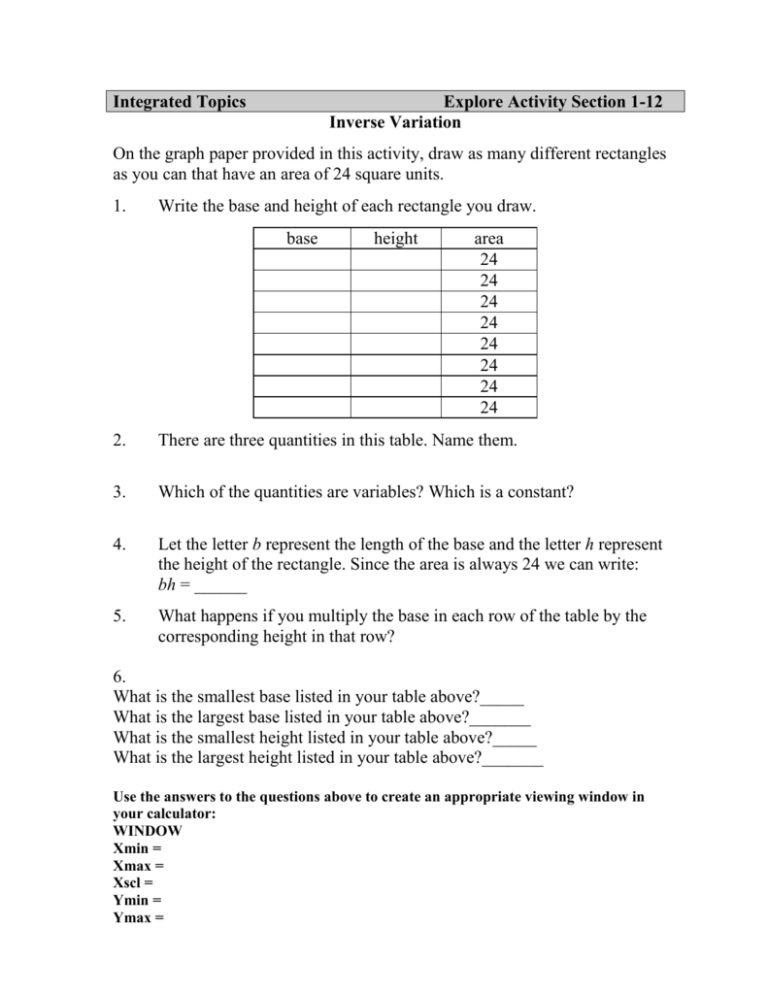
Integrated Topics Explore Activity Section 1-12 Inverse Variation On the graph paper provided in this activity, draw as many different rectangles as you can that have an area of 24 square units. 1. Write the base and height of each rectangle you draw. base height area 24 24 24 24 24 24 24 24 2. There are three quantities in this table. Name them. 3. Which of the quantities are variables? Which is a constant? 4. Let the letter b represent the length of the base and the letter h represent the height of the rectangle. Since the area is always 24 we can write: bh = ______ 5. What happens if you multiply the base in each row of the table by the corresponding height in that row? 6. What is the smallest base listed in your table above?_____ What is the largest base listed in your table above?_______ What is the smallest height listed in your table above?_____ What is the largest height listed in your table above?_______ Use the answers to the questions above to create an appropriate viewing window in your calculator: WINDOW Xmin = Xmax = Xscl = Ymin = Ymax = Yscl = Enter the values for the base in list 1 and the height values in list 2 of your graphing calculator. Use the steps below to create a scatter plot. STAT EDIT Cursor up to L1 hit clear - enter Cursor to L2 hit clear - enter Enter the values for the base in L1 Enter the values for the height in L2 hit 2nd y= (STAT PLOT) Enter Turn the Statplot ON cursor to the picture of the scatter plot enter Hit GRAPH Sketch and label the plot on the grid below. What do you notice about the shape of the scatter plot? The relationship you are working with in this problem set is called an inverse variation. An inverse variation is a relationship between two variables that can be expressed in the form: [one variable] times [other variable].= [constant] You should notice that as the value of one variable increases, the value of the other variable decreases. An inverse variation has the following properties: For every pair of variable values, the product formed when multiplying the value of one variable times the corresponding value of the other variable is always the same. This number is called the constant of variation. For the example you did at the beginning of this problem set, we will say that the base of the rectangle (b) varies inversely as the height (h). This relationship can be represented by the equation bh = 24 , where the number 24 is called the constant of variation. In general, if y varies inversely as x, we will write xy = k, where k is the constant of variation. Examine the relationship between the variables in the given table: speed 2 3 4 6 8 walking mph mph mph mph mph (s) Time to travel 6 hrs 4 hrs 3 hrs 2 hrs 1.5 hrs some distance (t) 7. Is this relationship an inverse variation? Justify your answer. 8. What number do you get if you multiply the variables in each column? 9. This number is called the constant of variation. Therefore the constant of variation is _________ The table below contains the attendance figures for a play when different prices are charged. Ticket Price (p) $2 $3 $4 $6 $9 $12 Attendance (A) 180 120 90 60 40 30 10. If the relationship between ticket price and attendance is an inverse variation, the product of the ticket price and attendance must always be the same. Is it? If so, what is that product? 11. Write an equation relating the variables. ______________ 12. Input the data from the table into lists in your graphing calculator (use the steps from problem #5), then make a scatter plot to confirm the fact that the scatter plot forms the same shape as in problem #5. A lever is set up to lift a box off the ground as shown in the diagram below. fulcrum The force (f) necessary to lift the box off the ground is varies inversely as the distance (d) you are from the fulcrum. (The fulcrum is the triangular piece on which the board you are pushing on rests.) Suppose that it takes 300 pounds of force to lift the box when you are 2 feet from the fulcrum. 13. What is the constant of variation? (Remember in an inverse variation the product of the variables is a constant.) 14. Write the equation relating the variables. 15. If you are at a distance of 3 feet from the fulcrum, how much force will you need to use? Integrated Topics Independent Practice Section 1-12 Direct and Inverse Variation Problems For each relationship, represented by a table, equation, or graph below, state whether the relationship between the two variables is a direct variation, an inverse variation, or neither. If the relationship is a direct or inverse variation, give the constant of variation. 1. People attending Prizes needed 2. Items bought Total Cost 3 5 6 8 9 10 6 10 12 16 18 20 2 4 6 8 10 12 $20 $32 $42 $54 $68 $80 20 30 40 45 60 90 18 12 9 8 6 4 3. Speed (kph) Time to get to NY (hr) 4. y = 20x 5. xy = 100 Solve the following problems. 6. 7. 8. Suppose that the fine for overdue library books varies directly as the number of days the book is overdue. Suppose a book that is overdue for five days has a fine of $0.90. a. Determine the constant of variation. b. What will the fine be for a book that is overdue for 12 days? Suppose that the height that a ball bounces varies directly as the height the ball is dropped from. Suppose that when a ball is dropped from a height of 10 feet it bounces 8 feet. a. What is the constant of variation? b. If a ball is dropped from a height of 16 feet, how high will the ball bounce? Write an equation for each direct or inverse variation given in the chart. a. x 4 5 6 7 y 10 8 6 2/3 7 1/8 Is the relationship direct or inverse?_______ How do you know? What is the constant of variation?____________ Write an equation that relates the variables? b. x y 4 15 5 30 6 45 7 60 Is the relationship direct or inverse?_______ How do you know? What is the constant of variation?____________ Write an equation that relates the variables?
