Transformations
advertisement
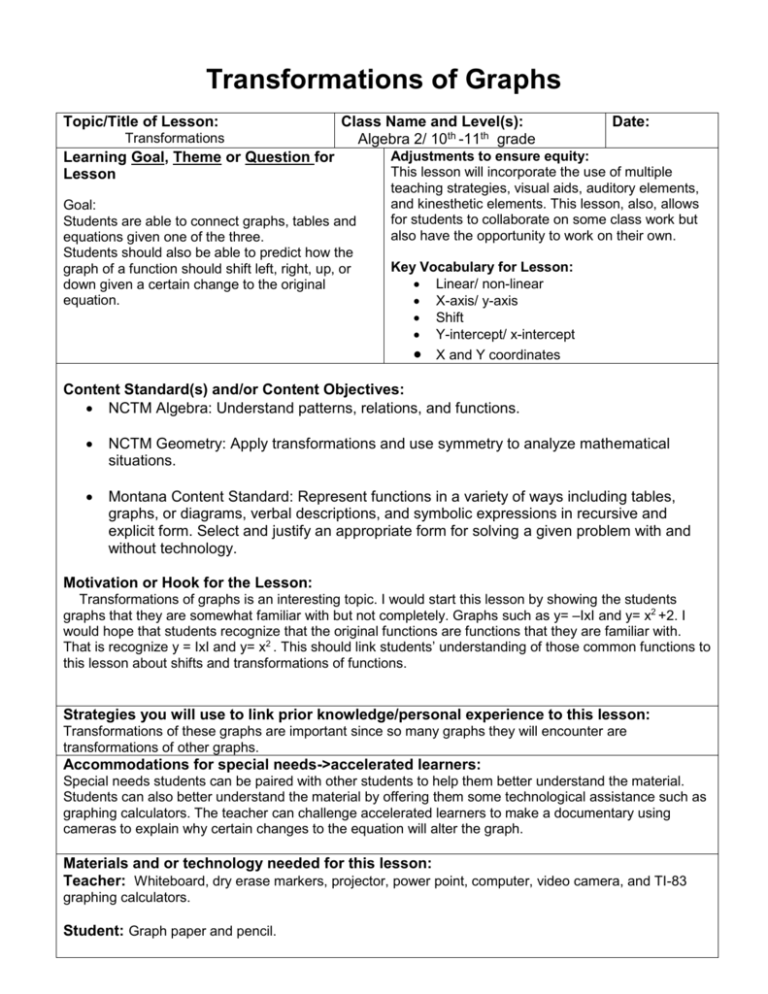
Transformations of Graphs Topic/Title of Lesson: Transformations Class Name and Level(s): Algebra 2/ 10th -11th grade Learning Goal, Theme or Question for Lesson Goal: Students are able to connect graphs, tables and equations given one of the three. Students should also be able to predict how the graph of a function should shift left, right, up, or down given a certain change to the original equation. Date: Adjustments to ensure equity: This lesson will incorporate the use of multiple teaching strategies, visual aids, auditory elements, and kinesthetic elements. This lesson, also, allows for students to collaborate on some class work but also have the opportunity to work on their own. Key Vocabulary for Lesson: Linear/ non-linear X-axis/ y-axis Shift Y-intercept/ x-intercept X and Y coordinates Content Standard(s) and/or Content Objectives: NCTM Algebra: Understand patterns, relations, and functions. NCTM Geometry: Apply transformations and use symmetry to analyze mathematical situations. Montana Content Standard: Represent functions in a variety of ways including tables, graphs, or diagrams, verbal descriptions, and symbolic expressions in recursive and explicit form. Select and justify an appropriate form for solving a given problem with and without technology. Motivation or Hook for the Lesson: Transformations of graphs is an interesting topic. I would start this lesson by showing the students graphs that they are somewhat familiar with but not completely. Graphs such as y= –IxI and y= x2 +2. I would hope that students recognize that the original functions are functions that they are familiar with. That is recognize y = IxI and y= x2 . This should link students’ understanding of those common functions to this lesson about shifts and transformations of functions. Strategies you will use to link prior knowledge/personal experience to this lesson: Transformations of these graphs are important since so many graphs they will encounter are transformations of other graphs. Accommodations for special needs->accelerated learners: Special needs students can be paired with other students to help them better understand the material. Students can also better understand the material by offering them some technological assistance such as graphing calculators. The teacher can challenge accelerated learners to make a documentary using cameras to explain why certain changes to the equation will alter the graph. Materials and or technology needed for this lesson: Teacher: Whiteboard, dry erase markers, projector, power point, computer, video camera, and TI-83 graphing calculators. Student: Graph paper and pencil. Learning Objectives: What should students know Assessment and Performance Levels: How and be able to do to demonstrate mastery of this concept/standard? will you assess your students’ attainment of the learning objectives? 1. Students will be able to identify the connections between the graphs, tables, and equations of important functions such as y=X2 and y=X3 as well as several other important non-linear functions. 2. Students will be able to identify what changes must be made to the equations of the functions in order to shift the function left, right, up or down a specific amount of units. 3. Students will be able to understand and convey why certain changes to the equations will transform the graph. And also be able to identify what changes have been made to the equation given the graph with the changes made. At the end of this lesson there will be a Jeopardy game. The students will be split into teams of 3-4 students. The students will be expected to work in groups as well as individually to demonstrate that they understand the material. There will be 1 category that requires the students to work in groups. This category will require the students to do multiple things such as given a graph. Write the equation of the function and make a table for at least 10 points. There will also be several categories: graphs, functions, tables, transformations/explanations and groups. This jeopardy game will assess all three learning outcomes. The categories require students to make connections between the graphs, tables, and functions and to identify them. The transformation category obligates the students to identify the changes of graphs given the function or vice-versa. This category will also force students to demonstrate that they understand what changes made to one form will make to the other. Last, there will be an explanations category that will require students to verbally explain why certain changes made will make certain changes. This requires students to have a deeper understanding of why things change the way that they do. Procedure/Sequencing of Lesson and Teaching Strategies Strategy/Minutes: Please indicate which strategy you will you use how much time you will devote to each __30_ mins. Modeling/ Whole Class work (includes Jeopardy activity) __10 _mins. Small Group/ independent practice (part of jeopardy activity) __10_ mins Partner Work (students will explore the graphs of equations in partners) Procedure for Lesson: Please describe a step by step procedure for your lesson 1. Introduction/ attention getter with interesting non-linear graphs. 2. Partner work. Students will be split into groups of 2-3 students. Each group of students will be given several equations to graph (this will require students to make a table for each function as well). An example would be y= x2 , y= (x-2)2, y= x2 – 2, y=(x+2)2, y=x2 +2, and y=(1/2x)2. Each group would get a different function. Then, I would have the students come up with the plain function first to sketch a graph of their function to show the class what their function looks like. This will happen for a couple of functions such as the square root function and x cubed as well. 3. As a class, we will explore why the changes to the graphs occur and thus get an idea of why certain shifts or changes happen. 4. Last, the Jeopardy game. Split students into 3 approximately even groups. The students will rotate threw so that only one student from each group will participate at a time (except for during the group category). 5. Here is an outline of what is expected for each category: a) Graphs- In this category, the students will be given the graph of a function. The students must come up with the equation of the graph or make a table of 10 points. The table must include the yintercepts and x-intercepts where appropriate. b) Tables- In this category, the students will be given a table of the function. The students will then have to give the function or make a graph of the function. The question will prompt which answer is wanted. c) Functions- This category will give the students the function. The students will have to either graph the function or make a table of the value of the function. The table must include the x-intercepts and y-intercepts where appropriate. d) Transformations/ Explanations- This category will make certain transformations to common graphs. This category will have a couple of different types of questions. The first type of question will give the students either a graph or a table of a function. The students are to come up with what the original function is and then verbally explain what shifts or changes have been made to the function to get the graph or table that is given. The second type of question will give the students the function and tell them what changes have occurred (ex. Shifted 3 units up). The students are to graph the function and verbally explain why their graph fits the given criteria. e) Groups- When the group category is selected, all members of the group can participate. The students will be given either a graph or the function itself. If they are given the function, then they are expected to make a table of 10 points (must include the y-intercept and the x-intercept where appropriate) and also make a graph of the function. When given the graph, the students are to make a table with 10 points (include the y-intercept and x-intercept where appropriate) and come up with the function that fits the graph. When students believe that they have the right answer, they are to bring their graph/table to the teacher to check before telling the rest of the students. This is to ensure that there are no hints are given if the students do not have the right answer and the rest of the groups have an opportunity to come up with the correct answer. At home work: Approximate time this work should take: __15- 20 minutes__ If desired, students can have some practice interpreting what changes will be made to the graph given the function or the original function and the shifts that are made. Students should practice graphing these nonlinear functions and shifts that are made. Reflection on Lesson/Notes to self: This lesson incorporates the use of technology as an assessment tool. The PowerPoint Jeopardy game enhances student learning by allowing for students to work together as well as individually to demonstrate that they understand the material. The technology incorporates a different aspect of the classroom that students do not get to use very often. Using the PowerPoint game is a great way for the teacher to evaluate where their students are at with learning the material. It also allows for the teacher to pay more attention to who is participating and who is not as well as to what extent each student understands the material since all students should have the opportunity to participate in the game.


