Algebra I - Washington State ESDs
advertisement
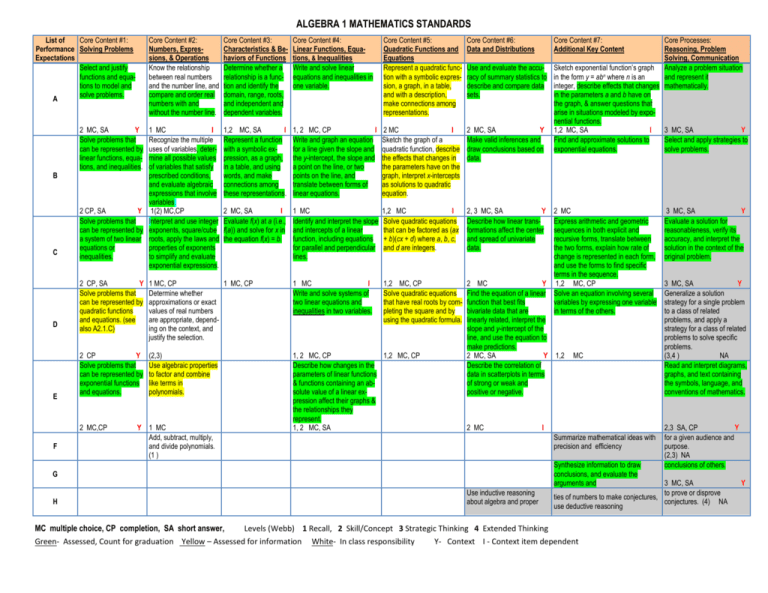
ALGEBRA 1 MATHEMATICS STANDARDS List of Core Content #1: Performance Solving Problems Expectations Select and justify functions and equations to model and solve problems. A B C D E 2 MC, SA Y Solve problems that can be represented by linear functions, equations, and inequalities. 2 CP, SA Y Solve problems that can be represented by a system of two linear equations or inequalities. 2 CP, SA Y Solve problems that can be represented by quadratic functions and equations. (see also A2.1.C) 2 CP Y Solve problems that can be represented by exponential functions and equations. 2 MC,CP F G H Core Content #2: Numbers, Expressions, & Operations Know the relationship between real numbers and the number line, and compare and order real numbers with and without the number line. Y Core Content #3: Characteristics & Behaviors of Functions Determine whether a relationship is a function and identify the domain, range, roots, and independent and dependent variables. Core Content #4: Linear Functions, Equations, & Inequalities Write and solve linear equations and inequalities in one variable. Core Content #5: Quadratic Functions and Equations Represent a quadratic function with a symbolic expression, a graph, in a table, and with a description, make connections among representations. Core Content #6: Data and Distributions Core Content #7: Additional Key Content Core Processes: Reasoning, Problem Solving, Communication Use and evaluate the accu- Sketch exponential function’s graph Analyze a problem situation racy of summary statistics to in the form y = abn where n is an and represent it describe and compare data integer, describe effects that changes mathematically. sets. in the parameters a and b have on the graph, & answer questions that arise in situations modeled by exponential functions. 1 MC I 1,2 MC, SA I 1, 2 MC, CP I 2 MC I 2 MC, SA Y 1,2 MC, SA I 3 MC, SA Y Recognize the multiple Represent a function Write and graph an equation Sketch the graph of a Make valid inferences and Find and approximate solutions to Select and apply strategies to uses of variables, deter- with a symbolic exfor a line given the slope and quadratic function, describe draw conclusions based on exponential equations. solve problems. mine all possible values pression, as a graph, the y-intercept, the slope and the effects that changes in data. of variables that satisfy in a table, and using a point on the line, or two the parameters have on the prescribed conditions, words, and make points on the line, and graph, interpret x-intercepts and evaluate algebraic connections among translate between forms of as solutions to quadratic expressions that involve these representations. linear equations. equation. variables. 1(2) MC,CP 2 MC, SA I 1 MC 1,2 MC I 2, 3 MC, SA Y 2 MC 3 MC, SA Y Interpret and use integer Evaluate f(x) at a (i.e., Identify and interpret the slope Solve quadratic equations Describe how linear transExpress arithmetic and geometric Evaluate a solution for exponents, square/cube f(a)) and solve for x in and intercepts of a linear that can be factored as (ax formations affect the center sequences in both explicit and reasonableness, verify its roots, apply the laws and the equation f(x) = b. function, including equations + b)(cx + d) where a, b, c, and spread of univariate recursive forms, translate between accuracy, and interpret the properties of exponents for parallel and perpendicular and d are integers. data. the two forms, explain how rate of solution in the context of the to simplify and evaluate lines. change is represented in each form, original problem. exponential expressions. and use the forms to find specific terms in the sequence. 1 MC, CP 1 MC, CP 1 MC I 1,2 MC, CP 2 MC Y 1,2 MC, CP 3 MC, SA Y Determine whether Write and solve systems of Solve quadratic equations Find the equation of a linear Solve an equation involving several Generalize a solution approximations or exact two linear equations and that have real roots by com- function that best fits variables by expressing one variable strategy for a single problem values of real numbers inequalities in two variables. pleting the square and by bivariate data that are in terms of the others. to a class of related are appropriate, dependusing the quadratic formula. linearly related, interpret the problems, and apply a ing on the context, and slope and y-intercept of the strategy for a class of related justify the selection. line, and use the equation to problems to solve specific make predictions. problems. (2,3) 1, 2 MC, CP 1,2 MC, CP 2 MC, SA Y 1,2 MC (3,4 ) NA Use algebraic properties Describe how changes in the Describe the correlation of Read and interpret diagrams, to factor and combine parameters of linear functions data in scatterplots in terms graphs, and text containing like terms in & functions containing an abof strong or weak and the symbols, language, and polynomials. solute value of a linear expositive or negative. conventions of mathematics. pression affect their graphs & the relationships they represent. 1 MC 1, 2 MC, SA 2 MC I 2,3 SA, CP Y Add, subtract, multiply, Summarize mathematical ideas with for a given audience and and divide polynomials. precision and efficiency purpose. (1 ) (2,3) NA Synthesize information to draw conclusions of others. conclusions, and evaluate the arguments and 3 MC, SA Y Use inductive reasoning to prove or disprove ties of numbers to make conjectures, about algebra and proper conjectures. (4) NA use deductive reasoning MC multiple choice, CP completion, SA short answer, Levels (Webb) 1 Recall, 2 Skill/Concept 3 Strategic Thinking 4 Extended Thinking Green- Assessed, Count for graduation Yellow – Assessed for information White- In class responsibility Y- Context I - Context item dependent
