lab7_fall
advertisement
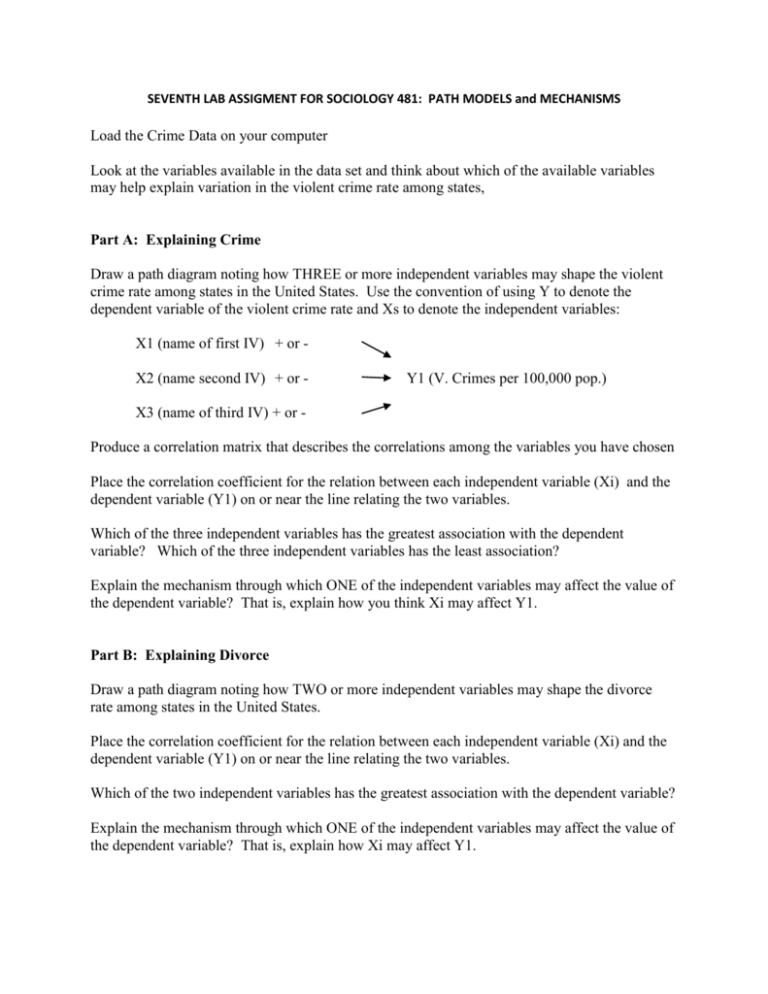
SEVENTH LAB ASSIGMENT FOR SOCIOLOGY 481: PATH MODELS and MECHANISMS Load the Crime Data on your computer Look at the variables available in the data set and think about which of the available variables may help explain variation in the violent crime rate among states, Part A: Explaining Crime Draw a path diagram noting how THREE or more independent variables may shape the violent crime rate among states in the United States. Use the convention of using Y to denote the dependent variable of the violent crime rate and Xs to denote the independent variables: X1 (name of first IV) + or X2 (name second IV) + or - Y1 (V. Crimes per 100,000 pop.) X3 (name of third IV) + or Produce a correlation matrix that describes the correlations among the variables you have chosen Place the correlation coefficient for the relation between each independent variable (Xi) and the dependent variable (Y1) on or near the line relating the two variables. Which of the three independent variables has the greatest association with the dependent variable? Which of the three independent variables has the least association? Explain the mechanism through which ONE of the independent variables may affect the value of the dependent variable? That is, explain how you think Xi may affect Y1. Part B: Explaining Divorce Draw a path diagram noting how TWO or more independent variables may shape the divorce rate among states in the United States. Place the correlation coefficient for the relation between each independent variable (Xi) and the dependent variable (Y1) on or near the line relating the two variables. Which of the two independent variables has the greatest association with the dependent variable? Explain the mechanism through which ONE of the independent variables may affect the value of the dependent variable? That is, explain how Xi may affect Y1.
