Differentation: glossary
advertisement
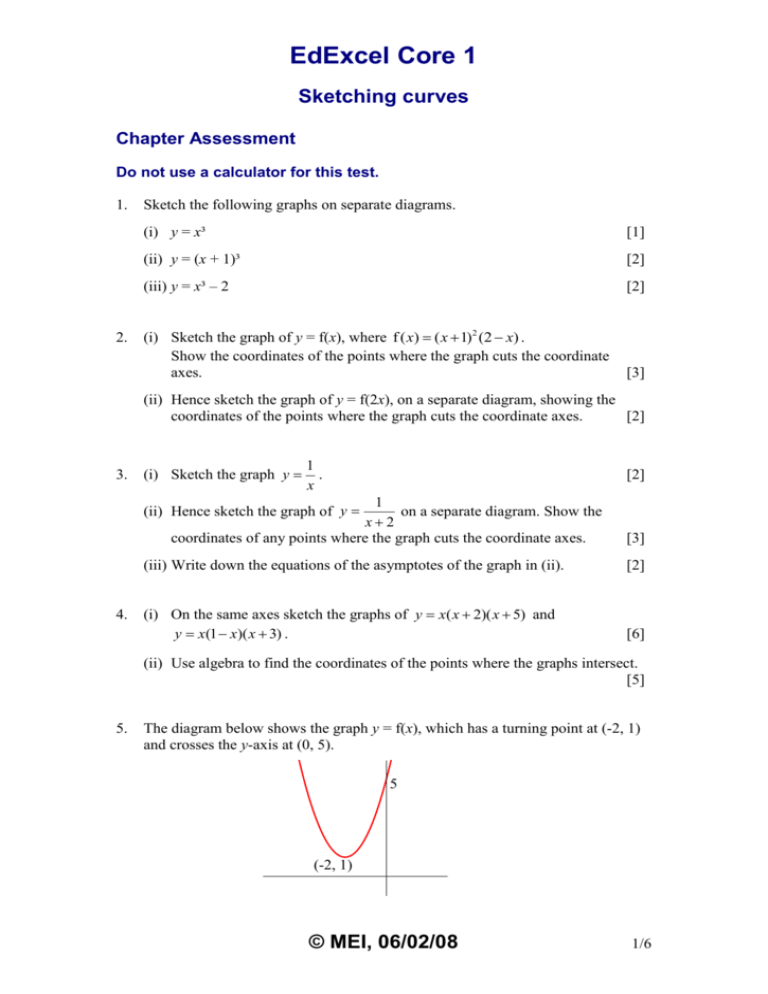
EdExcel Core 1 Sketching curves Chapter Assessment Do not use a calculator for this test. 1. 2. Sketch the following graphs on separate diagrams. (i) y = x³ [1] (ii) y = (x + 1)³ [2] (iii) y = x³ – 2 [2] (i) Sketch the graph of y = f(x), where f ( x) ( x 1)2 (2 x) . Show the coordinates of the points where the graph cuts the coordinate axes. [3] (ii) Hence sketch the graph of y = f(2x), on a separate diagram, showing the coordinates of the points where the graph cuts the coordinate axes. [2] 3. (i) Sketch the graph y 1 . x [2] 1 on a separate diagram. Show the x2 coordinates of any points where the graph cuts the coordinate axes. (ii) Hence sketch the graph of y 4. [3] (iii) Write down the equations of the asymptotes of the graph in (ii). [2] (i) On the same axes sketch the graphs of y x( x 2)( x 5) and y x(1 x)( x 3) . [6] (ii) Use algebra to find the coordinates of the points where the graphs intersect. [5] 5. The diagram below shows the graph y = f(x), which has a turning point at (-2, 1) and crosses the y-axis at (0, 5). 5 (-2, 1) © MEI, 06/02/08 1/6 EdExcel C1 Curves Assessment solutions Sketch, on separate diagrams, each of the following graphs, showing the coordinates of the turning point and the point at which the graph crosses the y-axis in each case. (i) y = f(x – 2) [3] (ii) y = 3f(x) [3] (iii) y = f( 12 x) [3] (iv) y = f(x) + 1 [3] Total 40 marks © MEI, 06/02/08 2/6 EdExcel C1 Curves Assessment solutions Sketching curves Solutions to chapter Assessment 1. (i) y = x³ (ii) y = (x + 1)³ The graph of y = x³ is translated 1 unit to the left. -1 (iii) y = x³ – 2 The graph of y = x³ is translated 2 units downwards. -2 2. (i) y ( x 1)2(2 x ) When x = 0, y = 2 When y = 0, x = -1 (repeated) or 2. When x is large and positive, y is large and negative. When x is large and negative, y is large and positive. © MEI, 06/02/08 3/6 EdExcel C1 Curves Assessment solutions y = f(x) 2 -1 2 (ii) The graph of y = f(x) is stretched in the x direction, scale factor 1 2 . y = f(2x) 2 21 3. (i) y 1 1 x 1 1 , the graph of y is translated 2 units to the left. x 2 x When x = 0, y 21 . (ii) To obtain y 1 2 © MEI, 06/02/08 4/6 EdExcel C1 Curves Assessment solutions (iii) The asymptotes are x = -2 and y = 0. 4. (i) y x( x 2)( x 5 ) When x = 0, y = 0 When y = 0, x = 0, -2 or -5 When x is large and positive, y is large and positive. When x is large and negative, y is large and negative. y x(1 x )( x 3) When x = 0, y = 0 When y = 0, x = 0, 1 or -3 When x is large and positive, y is large and negative. When x is large and negative, y is large and positive. y x(1 x )( x 3) -5 y x( x 2)( x 5 ) -3 -2 1 (ii) At intersections, x( x 2)( x 5 ) x(1 x )( x 3) x( x 2 7 x 10) x(3 2 x x 2 ) x 3 7 x 2 10 x 3 x 2 x 2 x 3 2 x 3 9x 2 7 x 0 x(2 x 2 9 x 7) 0 x(2 x 7)( x 1) 0 x 0, 72 , 1 When x = 0, y = 0 When x 72 , y 72 23 23 When x = -1, y 1 1 4 4 63 8 The points of intersection are (0, 0), 72 , 63 8 and (-1, -4). 5. (i) y = f(x – 2) The graph of y = f(x) is translated 2 units to the right. © MEI, 06/02/08 5/6 EdExcel C1 Curves Assessment solutions y = f(x – 2) (0, 1) (ii) y = 3f(x) The graph of y = f(x) is stretched in the y direction, scale factor 3. y = 3f(x ) (0, 15) (-2, 3) (iii) y = f( 21 x) The graph of y = f(x) is stretched in the x direction, scale factor 2. y = f( 21 x ) (0, 5) (-4, 1) (iv) y = f(x) + 1 The graph of y = f(x) is translated 1 unit upwards. y = f(x ) + 1 (0, 6) (-2, 2) © MEI, 06/02/08 6/6
